 Saad Ullah
Futures markets often move before spot prices do, and right now XRP is telling a story. CryptoQuant's data shows massive red "overheating" bubbles forming — the same pattern we saw before XRP's strongest runs in previous cycles.
What The Bubble Map Shows
According to Captain Redbeard, XRP futures volume has gone through the roof with whales and leveraged traders loading up big time.
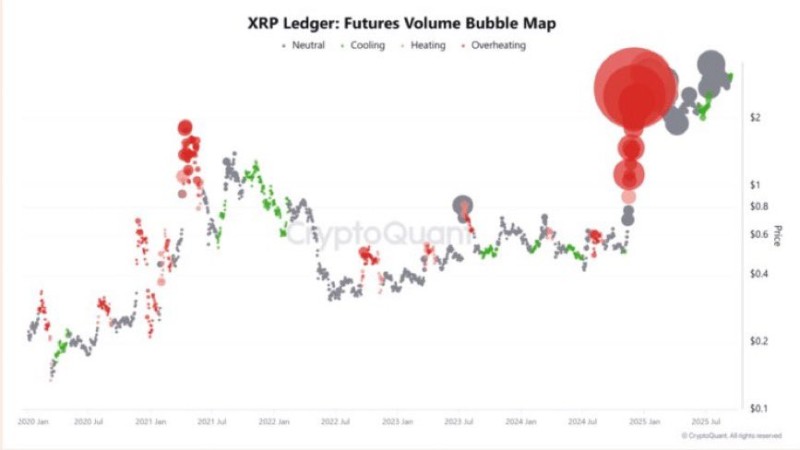
The chart uses color-coded bubbles to track futures activity:
- Gray/Green bubbles mean things are calm or cooling off
- Orange/Red bubbles signal heating up and overheating phases
Right now XRP is deep in the danger zone. Huge red bubbles are clustering around the $2 mark, showing traders are making massive leveraged bets on what comes next.
Why This Matters
When futures activity gets this hot, big moves usually follow. The surge in leverage means whales and institutions are positioning for something major. We've seen this movie before — similar overheating happened in 2021 and mid-2023 right before XRP exploded higher. But here's the catch: when everyone's leveraged to the hilt, liquidations can create violent swings in either direction.
 Saad Ullah


