 Peter Smith

The 15-min XRP/USDT chart on Bybit shows the coin got smacked down near $2.68–$2.70 and couldn't hold the breakout. Now it's slipping below the $2.66 level, which has flipped from support to resistance.
Here's what matters:
Chart analyst LSTRADER shared a 15-minute setup showing what looks like a classic liquidity grab before a correction—pretty typical for crypto when momentum fades.
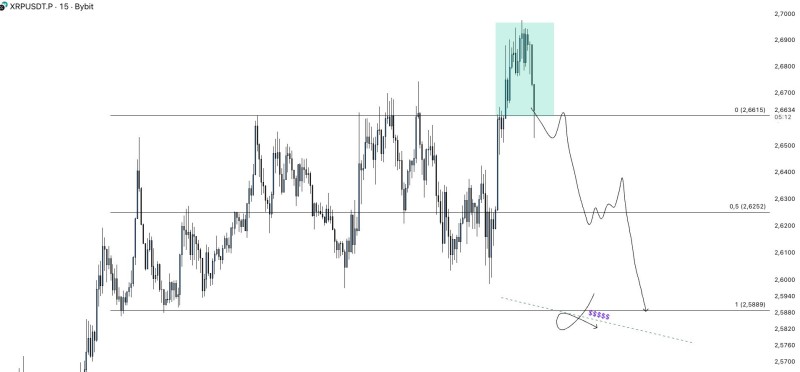
Resistance: $2.66–$2.68 is where sellers keep showing up
Mid-level: $2.62 might catch a quick bounce before things slide further
Main target: $2.58—marked with dollar signs on the chart as a likely liquidity zone where buyers could step back in
The hand-drawn price path suggests we're heading for a lower high, then down toward that $2.58 area. Standard corrective behavior for short-term scalping setups.
Bigger Picture: Just Cooling Off
This pullback fits with what's happening across altcoins right now. Bitcoin's moving sideways with low volume, and XRP tends to follow BTC's lead on shorter timeframes.
But the overall trend isn't broken. This looks more like healthy consolidation than anything alarming—probably just a temporary breather before the next move.
What to Watch
- $2.66: If XRP breaks back above here cleanly, the bearish setup's off and we could retest $2.70
- $2.62–$2.58 zone: Key support where dip buyers might jump in
- Market vibe: If confidence returns broadly, XRP could bounce quickly once this correction plays out
 Peter Smith


