 Peter Smith

⬤ A familiar technical pattern is taking shape on XRP's chart—one that experienced traders tend to recognize immediately. The extended sideways zone, marked in yellow, shows XRP consolidating tightly for weeks within a narrow range. This type of structure has historically appeared before significant upward moves. The development comes as regulators debate new tax proposals that could expand reporting requirements for digital assets, potentially increasing compliance costs for smaller firms and pushing some talent toward friendlier jurisdictions—adding a regulatory backdrop to the current XRP coin news cycle.
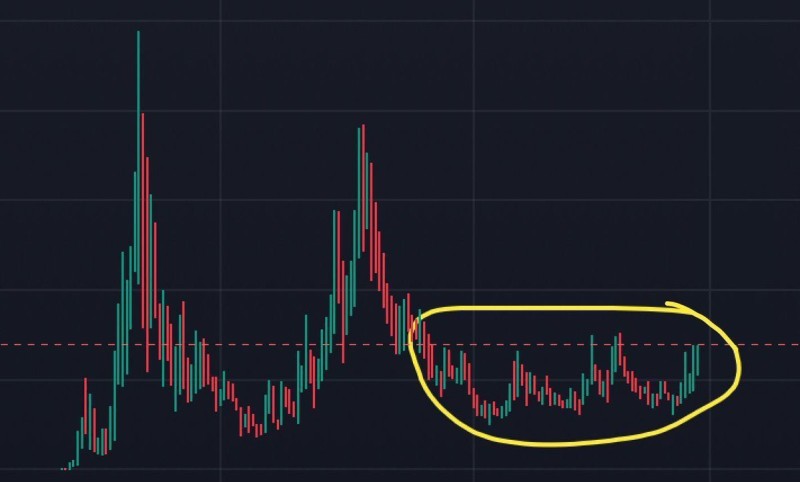
⬤ The technical setup shows consistent sideways price action following an earlier decline. The pattern suggests gradual accumulation, with repeated bounces off support and slightly higher reaction highs. Traders often view this as early-stage base-building—a necessary step before strong continuation moves. Analysts note that these prolonged stabilization phases can lead to sharp rallies once resistance finally breaks, assuming market liquidity stays healthy and regulatory pressure doesn't suddenly intensify.
⬤ The visual highlight on the chart clearly outlines this coiled structure, with candles compressing toward the upper boundary of the range. Many chart-based analysts see this rounded accumulation zone as a setup for directional expansion, echoing patterns that have played out successfully in the past.
⬤ As XRP coin news continues drawing attention, market participants are watching to see if XRP can turn this accumulation into a confirmed breakout. They're also keeping an eye on upcoming tax policy decisions that could affect trading participation and liquidity across the sector. If the pattern follows its historical playbook, this current structure could be the foundation for the next sustained upward move.
 Peter Smith


