 Marina Lyubimova
⬤ XRP's been sitting comfortably above $2, and if you look at the multi-year chart, there's what appears to be a completed consolidation pattern that's now broken into fresh upward territory. Market commentator pointing out that the structure looks pretty clean—momentum's building, liquidity's lining up right, and here's the kicker: they're saying XRP hitting $20+ isn't some fantasy anymore. They're expressing real confidence in how this long-term setup's shaping up.
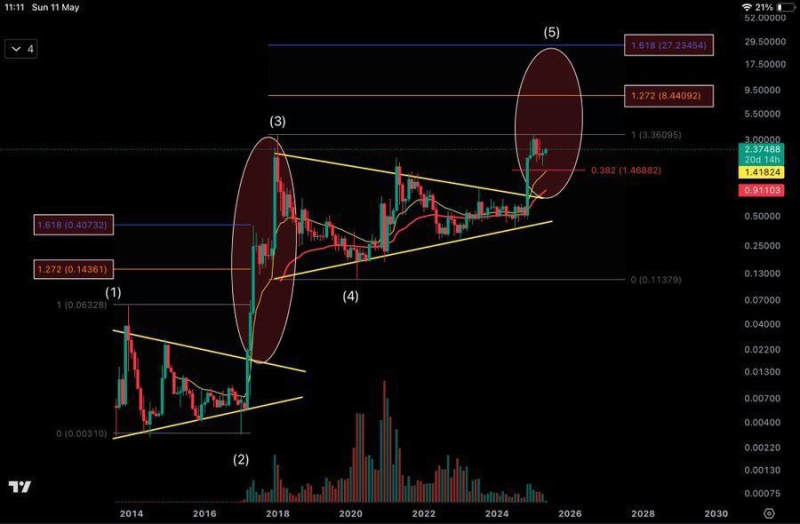
⬤ The chart tells quite a story when you zoom out over roughly ten years. You've got these labeled wave structures showing previous big rallies followed by those painfully long consolidation periods we all remember. What's interesting now is this latest move up is being framed as a fifth wave advance. The Fibonacci projections are showing some juicy targets—$8.44 at the 1.272 extension and around $27.23 at the 1.618 level. Right now we're sitting near $2.37, trading above what used to be resistance, with that 0.382 retracement area down around $1.47 acting as a floor.
⬤ If you look at the chart's history, there are two previous massive upside explosions marked by shaded regions where price just rocketed out of tight ranges. The volume bars at the bottom show serious activity during those breakout moments, while recent trading had been relatively quiet before this latest push higher. The way it's being presented, the breakout's already happened and the overall trend structure looks supportive for continued long-term momentum.
⬤ Well, XRP's still one of the heavyweight digital assets out there, and when long-term technical setups like this get attention, they tend to influence how the market feels about where price might be headed. These clearly defined chart patterns and widely-watched Fibonacci targets become reference points that traders use to gauge trend strength, figure out their risk appetite, and set expectations for future price discovery—not just for XRP but across the broader crypto landscape.
 Marina Lyubimova


