 Victoria Bazir

After months of choppy price action, XRP (Ripple)might be setting up for its next big move. A recent chart analysis highlights a technical pattern that's shown up before at key turning points — and if history repeats itself, we could be looking at the early stages of another substantial rally.
Bearish EMA Flip: A Pattern Worth Watching
The chart shared by analyst STEPH IS CRYPTO shows XRP's daily performance on Binance, using a layered EMA ribbon indicator that tracks multiple Exponential Moving Averages. What makes this interesting is how consistently these "bearish flips" — when shorter EMAs cross below longer ones — have marked the end of downtrends and kicked off strong upward moves.
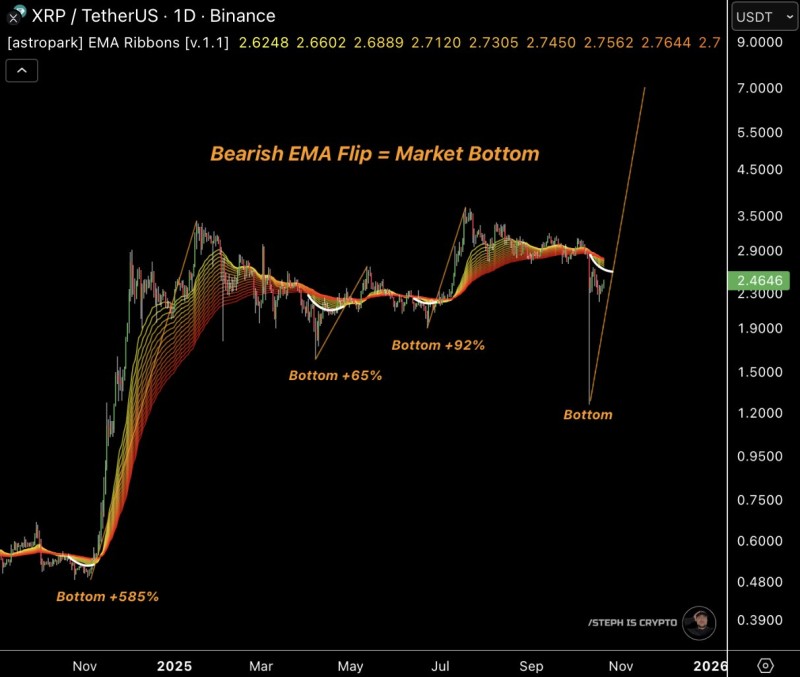
Looking back at XRP's history, the last three major EMA flips led to gains of +585%, +65%, and +92% respectively. The latest flip is now showing up again, suggesting XRP could be entering another accumulation phase before potentially breaking higher.
Where XRP Stands Now
Right now, XRP is trading around $2.46 after bouncing back from a sharp drop earlier this quarter. The EMA ribbons are starting to flatten out and squeeze together, which typically signals that selling pressure is running out of steam. The price seems to be finding support between $2.30 and $2.40, while resistance sits around $2.90 and $3.50. If XRP can hold this level and start pushing the EMAs back upward, it would confirm what many traders are hoping for: a genuine mid-term trend reversal.
Broader Market Context
This technical setup is happening as the wider crypto market starts showing renewed strength heading into late 2025. Institutional money has been flowing into altcoins, and there's growing buzz around DeFi applications being built on the XRP Ledger. For traders who've been through XRP's cycles before, seeing this Bearish EMA Flip act as a bottom marker feels like a familiar and potentially bullish sign that another multi-month rally could be brewing.
 Victoria Bazir


