 Saad Ullah
⬤ Solana is hovering near a crucial technical level after sweeping the $130 support zone during another volatile trading session. The price dipped below this threshold before recovering slightly to around $136.82, and now the question is whether bulls can secure a daily close above $130. The current candle shows signs of stabilization as selling pressure eases around this established support level.
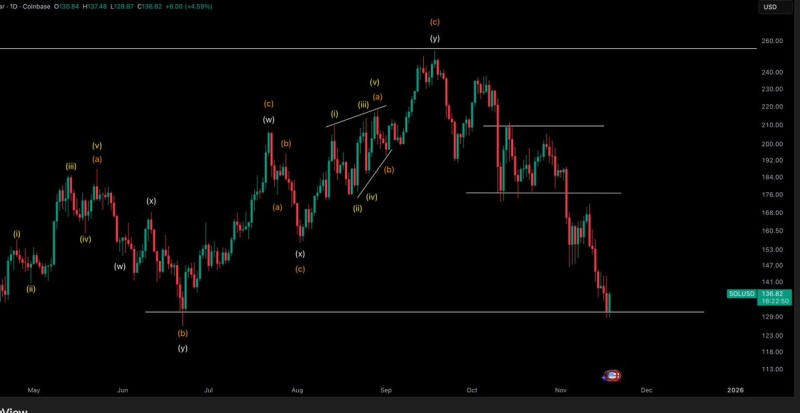
⬤ The recent chart reveals Solana has been stuck in correction mode for several weeks, printing lower highs and breaking through multiple mid-range support levels. The $130 sweep corresponds with a horizontal zone that previously triggered rebounds during earlier consolidation periods. The broader structure shows failed attempts to reclaim momentum near the $175 and $210 resistance areas. With price now reacting directly at the bottom support line, the market is testing whether buyers have enough strength left to stop the bleeding.
⬤ Market sentiment has noticeably cooled after Solana's steep drop from above $220 earlier this quarter. Multiple consecutive red daily candles led into the recent support sweep, keeping pressure on the downside. While Elliott Wave patterns suggest the broader correction might be running out of steam, there's no confirmation yet of any directional shift beyond this immediate support test. Momentum remains shaky, and bulls need a confirmed daily close above $130 to signal even short-term stability. If this level fails, there's limited visible support below, which could open the door to deeper losses.
⬤ The $130 zone matters because it's been a structural anchor throughout this recent downtrend cycle. How Solana performs here will shape broader market sentiment and determine whether a recovery phase is even possible. A sustained hold could rebuild confidence and set up consolidation, while a breakdown would likely reinforce bearish momentum across the altcoin space.
 Saad Ullah


