 Peter Smith
Solana just shook off weeks of sideways action and is making traders pay attention again. The chart's telling a clear story - bullish market structure shifts are stacking up, demand zones are holding like concrete, and everything points toward a run at $260. This isn't just another crypto pump; the technicals are actually backing this move.
What the Charts Are Screaming
According to trader Crypt0_Nova, Solana's printing textbook bullish signals:
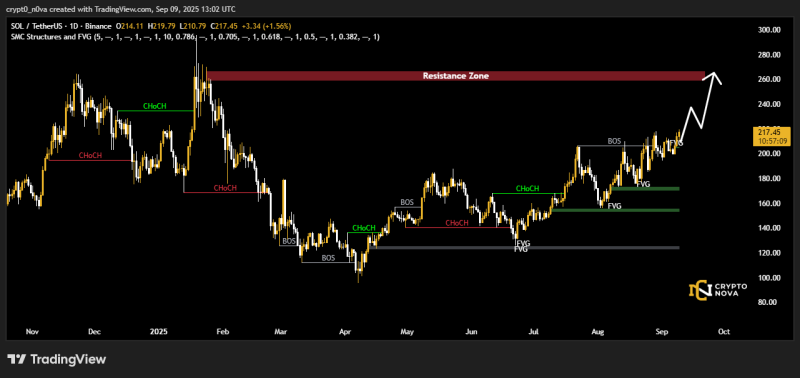
- Break of Structure confirmations after every pullback - buyers keep stepping in
- Fair Value Gaps around $160-$190 acting like magnets for support - these zones got retested and held
- $250-$260 resistance zone sitting there like the final boss level
The structure's clean. SOL keeps making higher highs and higher lows, which is exactly what you want to see in an uptrend. Those demand zones between $160-$190 have been battle-tested and they're not breaking. That's institutional-level support right there.
Why SOL Is Actually Moving
This isn't happening in a vacuum. Solana's ecosystem keeps growing because developers love the speed and cheap transactions. The broader crypto market's catching a bid too, which means money's flowing into solid altcoins like SOL. Plus, risk appetite is back - people are willing to bet on growth again instead of hiding in stablecoins.
The network fundamentals support the price action. High throughput, low fees, and a developer community that actually builds stuff. When the market wants to rotate into alts, SOL usually gets the call.
 Peter Smith


