 Peter Smith

⬤ Solana returned to an important technical zone this week, with SOL trading around $133 and revisiting the same support area that marked previous turning points on the weekly chart. This level lines up with past RSI and Williams Percent Range readings that came before notable recoveries, making the current test worth watching closely.
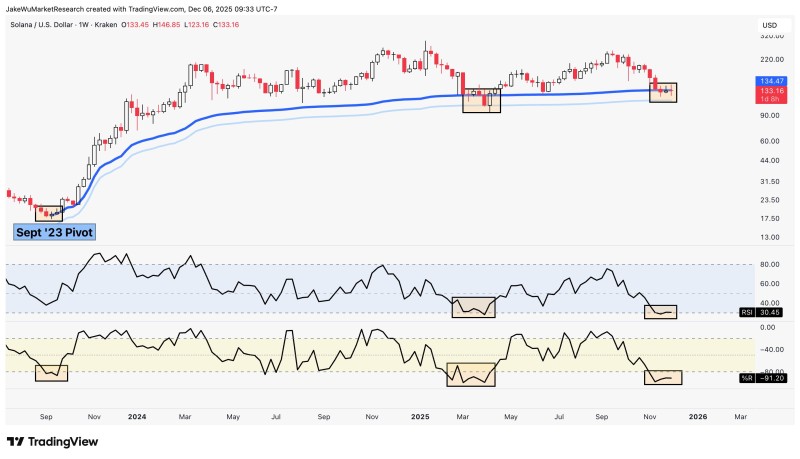
⬤ The chart reveals several historical moments when Solana found its footing as momentum indicators dropped into oversold territory. When RSI approached 30 and Williams Percent Range hit around -90, downside pressure typically eased before constructive price movement emerged. Current readings sit almost exactly in those ranges, while price interacts with clustered moving averages that formed support during earlier pullbacks.
⬤ Recent weekly candles show a measured decline rather than chaotic selling. Each time SOL touched this blue support band, it either consolidated or bounced as selling momentum faded. The current setup mirrors those earlier patterns, which is why traders are watching this zone as a potential decision point.
⬤ This moment matters because it brings together long-term support, historical reaction zones, and oversold momentum signals all at once. When these elements align, markets often reassess their direction, influencing broader sentiment across altcoins. Whether Solana holds, reverses, or breaks lower from here will likely shape near-term expectations around risk appetite and market strength.
 Peter Smith


