 Marina Lyubimova

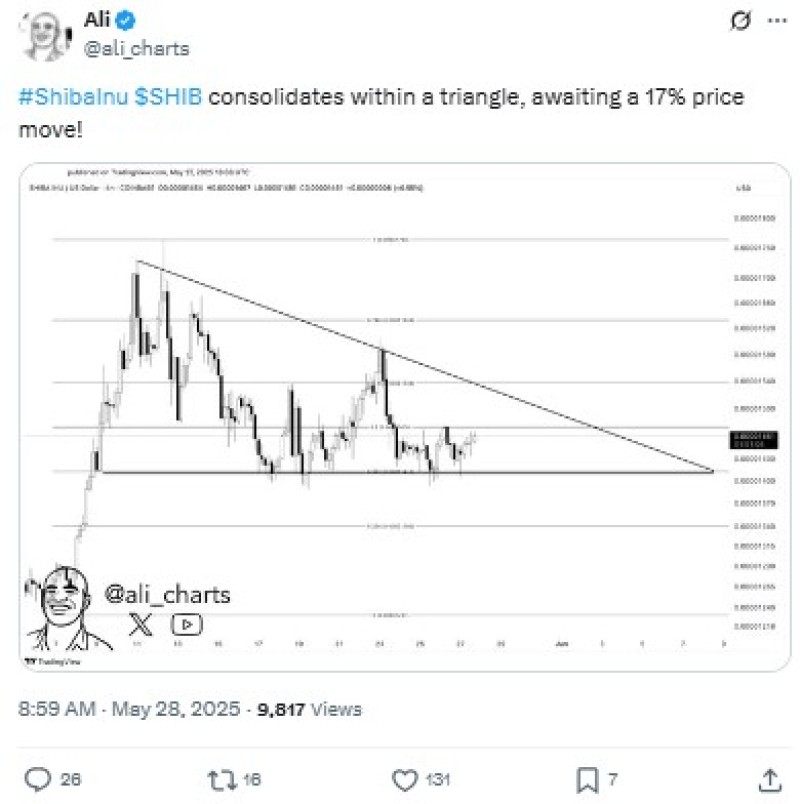
Shiba Inu (SHIB) is stuck in a tight triangle that's about to snap - and when it does, we could see a solid 17% move in either direction.
Shiba Inu (SHIB) has been everyone's favorite meme coin rollercoaster, and right now it's sitting at what looks like a pretty important crossroads. The price action has been getting tighter and tighter, and traders are starting to pay attention because something's gotta give soon.
SHIB Triangle Pattern is About to Pop
So here's what's happening with Shiba Inu (SHIB) right now - it's been stuck in this descending triangle pattern for nearly two weeks on the four-hour chart. The price is hanging around $0.0000146, just barely holding above some key support levels.
What we're seeing is classic triangle behavior. You've got these lower highs that keep putting pressure on the price, but there's this solid support floor around $0.0000143 that just won't budge. It's like watching a spring get compressed - eventually something's got to give, and when it does, it usually moves fast.
The thing about these triangle patterns is they don't mess around. They're basically the market's way of saying "okay, we're done with the sideways stuff, time to pick a direction." And based on how this one's shaping up, we could be looking at some serious movement once it breaks.
SHIB Price Could Hit These Levels Next
If this triangle breaks the way technical analysis suggests, Shiba Inu (SHIB) has two main destinations it could hit. On the upside, we're looking at around $0.0000175 - that's where the 17% gain would take us if buyers manage to push through the resistance.
But here's the flip side - if this thing breaks down instead of up, SHIB could easily slide down to about $0.0000134. That's the risk you're taking with these patterns. They work both ways, and the market doesn't care about your feelings.
Right now, the action is pretty dead. Low volume, sideways movement - it's like everyone's just waiting for someone else to make the first move. That's actually pretty normal before these breakouts happen. The calm before the storm, if you will.
SHIB Has Been on a Bit of a Recovery Mission
Looking at where Shiba Inu (SHIB) stands for the year, things aren't terrible. We're up about 7.8% in May alone, which is actually pretty decent considering how rough the start of 2025 was. Those first three months were brutal - double-digit losses across the board in January, February, and March.
But here's something that should make SHIB holders a bit nervous - June historically sucks for this coin. We're talking average losses of 15.1% based on the last few years. So even if we get that upside breakout, there might be some seasonal headwinds coming up.
It's interesting how these patterns play out. The market gives you hope with some gains, then reality checks you with historical data. That's crypto for you - never a dull moment.
SHIB Quarterly Numbers Tell an Interesting Story
The bigger picture for Shiba Inu (SHIB) this year has been wild. After getting absolutely hammered in Q1 with over 40% losses, the coin has actually bounced back pretty nicely in Q2 with a 15.3% gain so far.
But - and there's always a but - that recovery hasn't exactly been screaming higher. It's been more of a slow grind, which is how we ended up in this triangle pattern in the first place. The buyers showed up to stop the bleeding, but they haven't been aggressive enough to really push prices significantly higher.
This kind of action usually means the market is still figuring things out. Bulls and bears are basically in a standoff, and that's exactly what triangle patterns represent - indecision that's about to become very decisive.
SHIB Technical Setup Looks Pretty Textbook
From a pure technical standpoint, this Shiba Inu (SHIB) triangle is about as clean as they get. You've got clear boundaries, decreasing volume, and time running out - all the ingredients for a proper breakout.
The 17% target isn't just some random number either. That's based on the height of the triangle pattern, which is how these things typically measure their moves. Whether we hit $0.0000175 on the upside or $0.0000134 on the downside depends on which way the market decides to go.
What's really going to matter here is volume. If we get a breakout with decent volume behind it, that's usually a good sign the move has legs. But if it's just a fake-out with weak volume, well, that's when things get tricky and you might see a quick reversal back into the pattern.
 Marina Lyubimova


