 Victoria Bazir

⬤ SEI is trading right under a descending trendline near $0.13 that's been controlling price movement for several weeks now. This resistance has repeatedly pushed the price back down, with multiple rejection points visible since early November. Each time SEI approaches this line, it gets turned away.
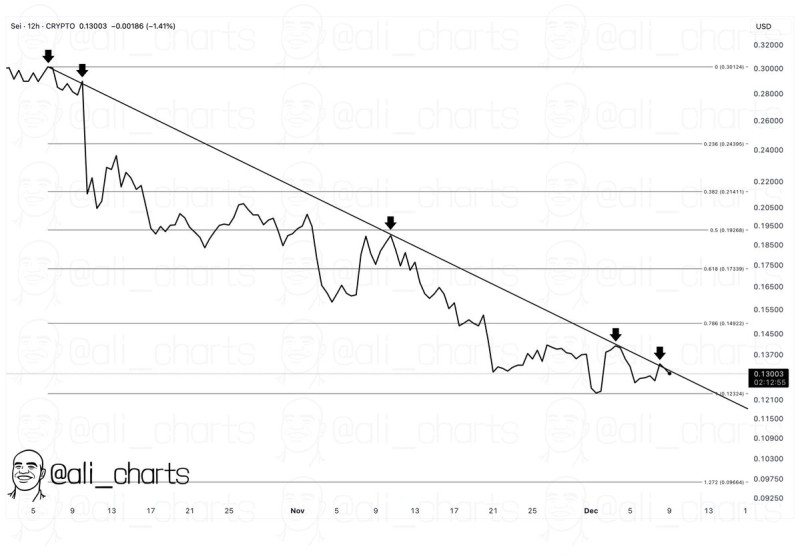
⬤ The pattern is clear: SEI keeps trying to push higher, but the trendline stops it cold. The chart shows a series of lower highs at roughly $0.24, $0.21, $0.19, $0.17, $0.15, and most recently around $0.14. While SEI has bounced off support levels between $0.11 and $0.12 a few times, none of these rebounds had enough strength to crack through the resistance.
⬤ Right now, SEI is consolidating just below this resistance level. The price is moving sideways in a tight range, showing that traders are hesitant but definitely keeping an eye on this key level. The fact that price keeps respecting this same downward-sloping line shows just how important it's become.
⬤ When an asset gets squeezed under persistent resistance like this for an extended period, it usually leads to a volatility spike. As long as SEI stays below the trendline, the cautious market tone continues. But if it manages to break above, that could signal a real shift in momentum and change how traders view the asset going forward.
 Victoria Bazir


