 Marina Lyubimova

SEI has faced months of downward pressure, but recent price action suggests a potential trend reversal. A bullish retest at key support could trigger a significant rally, with traders now eyeing higher Fibonacci levels as the token approaches a decisive breakout.
SEI Chart Analysis: Bullish Retest in Focus
According to trader Ali's analysis, SEI is trading around $0.29 while holding above a long-term descending trendline. The token maintains support above $0.28–0.30, and a sustained bounce would strengthen bullish momentum.
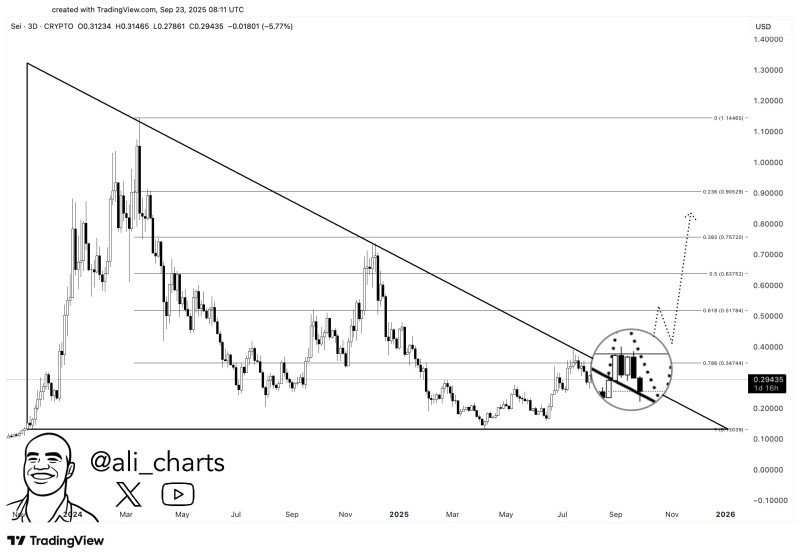
The critical level is $0.35 – historically strong resistance that now serves as the "make-or-break" zone. Successfully flipping $0.35 into support would open Fibonacci targets at $0.51, $0.63, and ultimately $0.90. The trendline convergence adds significance, as a clean breakout would signal buyers taking control.
Why This Setup Matters
SEI has broken from a multi-month downtrend and is consolidating in a healthy retest phase. The broader altcoin market is seeing renewed interest, which could accelerate momentum. Extended sideways trading has compressed volatility, typically preceding strong directional moves.
Conclusion: $0.35 Remains the Key Level
SEI's ability to reclaim $0.35 as support is the crucial signal traders await. Successfully holding this zone makes the technical path toward $0.90 viable. However, failure to maintain support above $0.28 could invalidate the bullish scenario and trigger a deeper correction.
 Marina Lyubimova


