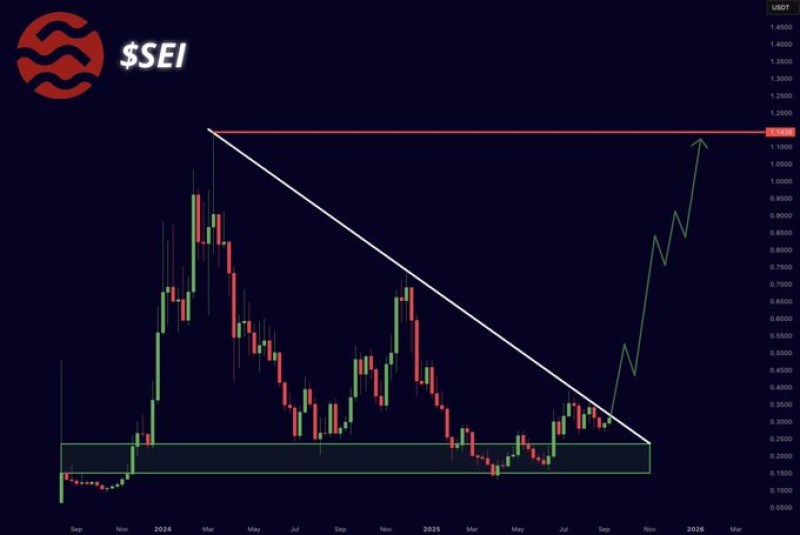
SEI is approaching a pivotal technical moment. After months of building a foundation at key support levels, the coin is now challenging a major downtrend line. A successful breakout could unleash a strong rally toward $1.10, representing one of the most significant technical developments for SEI this year.
Chart Analysis: Support, Breakout Trigger, and Target
The SEI/USDT chart reveals a well-defined accumulation phase with a breakout scenario developing. Analyst Sei Intern has highlighted this setup as particularly compelling, noting the coin's potential for substantial gains once resistance breaks.

The technical picture shows several key elements:
- Accumulation base: A robust green support zone has absorbed selling pressure consistently, indicating strong underlying demand
- Descending trendline: Price is testing a critical white downtrend line that has capped rallies for months
- Upside projection: A breakout targets a stepped advance toward $1.10, marked by the red resistance boundary
- Risk consideration: Failure to maintain support could push SEI back into consolidation, postponing the breakout timeline
Why SEI Could Break Higher
Several factors support a potential upside move. Compression dynamics along the descending trendline typically precede significant volatility expansions. Market rotation patterns suggest that as Bitcoin finds stability, speculative capital often flows into altcoins like SEI. Additionally, ongoing ecosystem developments and liquidity enhancements provide fundamental backing for a potential rally.
Key Price Levels for SEI
Critical levels to monitor include breakout confirmation above the descending trendline on a weekly closing basis. Interim resistance checkpoints appear at $0.80, $0.90, and $1.00 as natural stepping stones. The primary target remains $1.10, corresponding to the red resistance level identified in the technical analysis. The invalidation scenario involves a breakdown into the lower portion of the green support zone, which would negate the current bullish thesis.
 Saad Ullah

 Saad Ullah


