 Marina Lyubimova

⬤ PEPE has hit a crucial technical crossroads after weeks of steady decline, and the charts are starting to tell a different story. According to analyst @STEPHISCRYPTO, the meme coin might be gearing up for a momentum shift. Looking at the 3-day KuCoin chart, PEPE is hovering around the $0.00000410 mark, where the price has started to tighten up after a long string of lower highs and lower lows.
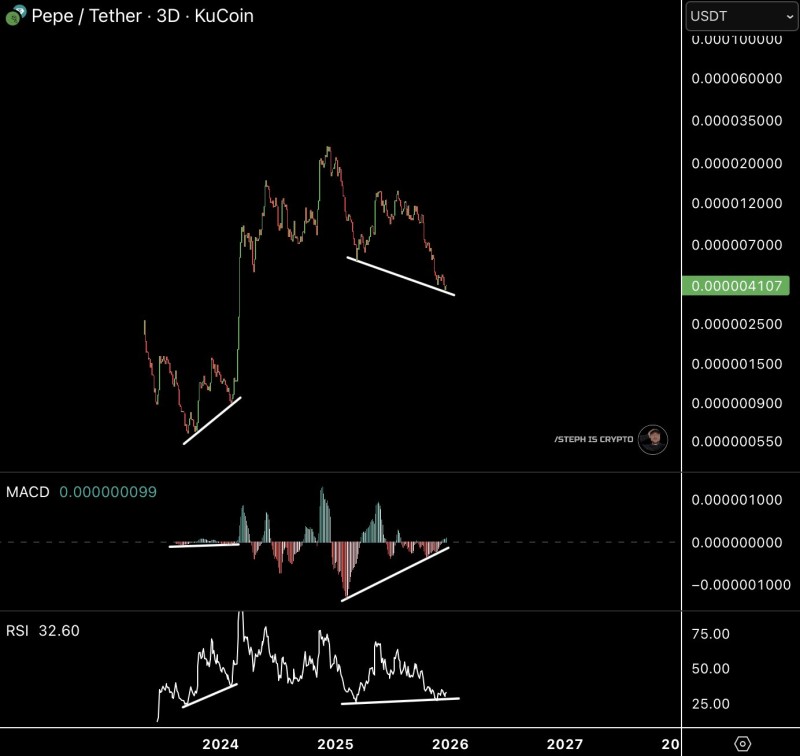
⬤ The chart shows a descending trendline that's been acting as a ceiling, but here's what's interesting—the downward pressure has noticeably slowed near recent support zones. This kind of behavior usually means the bears are running out of steam rather than doubling down. PEPE is still trading below its previous peaks, but the pace of the selloff has clearly cooled off, which suggests sellers might be losing their grip as the price consolidates.
⬤ The momentum indicators back this up. The MACD histogram is showing a bullish divergence—basically, momentum is making higher lows while the price keeps drifting down. Traders know this pattern often signals that a trend is running out of gas. Meanwhile, the RSI sits near 32 on the higher timeframe, putting PEPE close to oversold territory. When RSI stabilizes in this range, it typically comes before a quieter period and sometimes a shift in direction.
⬤ This setup matters for the broader crypto market since meme coins like PEPE tend to move fast once momentum flips. There's no confirmed breakout yet, but the mix of tightening price action, MACD divergence, and low RSI readings suggests PEPE is nearing a turning point. How it reacts around current support and that descending resistance line will determine whether this develops into a real reversal or just extends the sideways grind.
 Marina Lyubimova


