 Eseandre Mordi

⬤ Ethereum is edging toward a critical price zone that could trigger massive liquidations in the derivatives market. Over $3 billion worth of ETH short positions sit vulnerable if the asset breaks above $3,500. The ETH Exchange Liquidation Map reveals a heavy concentration of leveraged short bets stacked above current prices, showing just how exposed bearish traders have become.
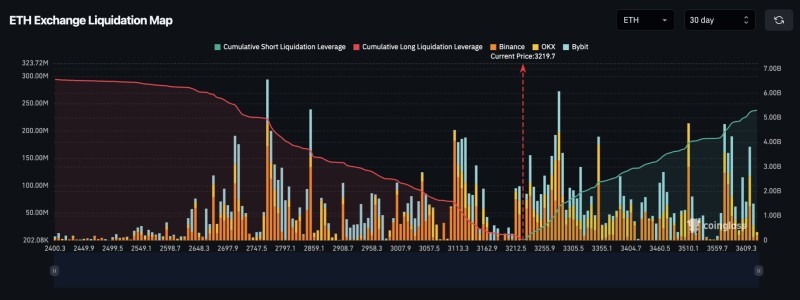
⬤ Trading data from Binance, OKX, and Bybit paints a clear picture. Liquidation clusters thicken dramatically between $3,300 and $3,500, with cumulative short exposure climbing toward roughly $5 billion in the upper ranges. Meanwhile, long liquidation levels look tiny by comparison. With ETH hovering around $3,219, the price sits right beneath where these liquidation zones start to balloon, meaning even a modest rally could set off a cascade of forced closures.
⬤ This setup fits into a bigger pattern where high leverage has been cranking up volatility across crypto derivatives. Past liquidation waves on the chart line up with sharp price jumps, proving that these dense stop-loss zones keep driving market moves. Right now, ETH price action depends less on classic technical levels and more on where liquidation pressure is building.
⬤ A push above $3,500 would put the market to the test, potentially flipping short-term momentum if billions in short positions get squeezed. With over $3 billion concentrated in bearish bets, any breakout could spark sudden volatility and shift sentiment across the broader crypto space.
 Eseandre Mordi


