 Saad Ullah

⬤ Ethereum is sitting at a make-or-break technical level that could determine its next move. The price is hovering near $3,035 USDT, right where the 20-day simple moving average sits on the daily chart. ETH is currently trading between the Bollinger Bands, with the candle touching that orange 20-day SMA line that's becoming increasingly important for bulls trying to defend this bounce.
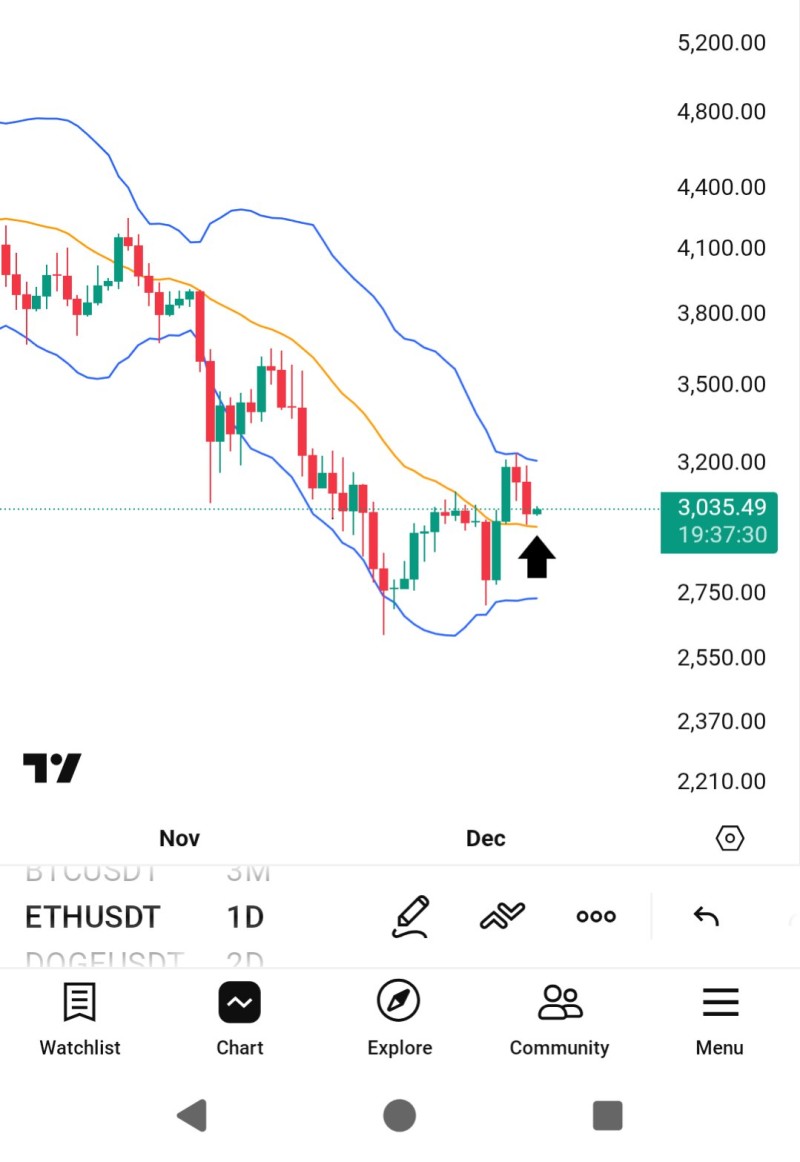
⬤ After pushing toward the upper Bollinger Band earlier this week, ETH has pulled back and is now testing the mid-band area. The chart marks the 20-day SMA with an arrow showing exactly where support needs to hold. If buyers can keep the price above this moving average, it signals they're committed to defending the trend. Drop below it, and we're likely looking at more of the choppy correction that's dominated since November.
⬤ The bigger picture shows ETH coming off a rough selling period and now attempting to stabilize. The price is gravitating toward the center of those volatility bands, and how it behaves around the 20-day SMA is basically the whole story right now. Holding above this line would give traders more confidence to push higher, but losing it probably means we're stuck in sideways action for longer.
⬤ This 20-day SMA level has become the focal point for anyone trading Ethereum right now. It's where the market is deciding between continuing the recovery or admitting the momentum isn't there yet. A solid hold above could shift sentiment and open the door to testing higher resistance zones. Fail here, and Ethereum might just keep grinding sideways until something else changes the narrative.
 Saad Ullah


