 Alex Dudov

⬤ Ethereum is trading near $2,306 after an 18% weekly drop, now sitting at a support zone that's been defended repeatedly since 2023. This level around $2,300 has become one of the most watched areas on ETH's chart, acting as a launching pad for previous rallies.
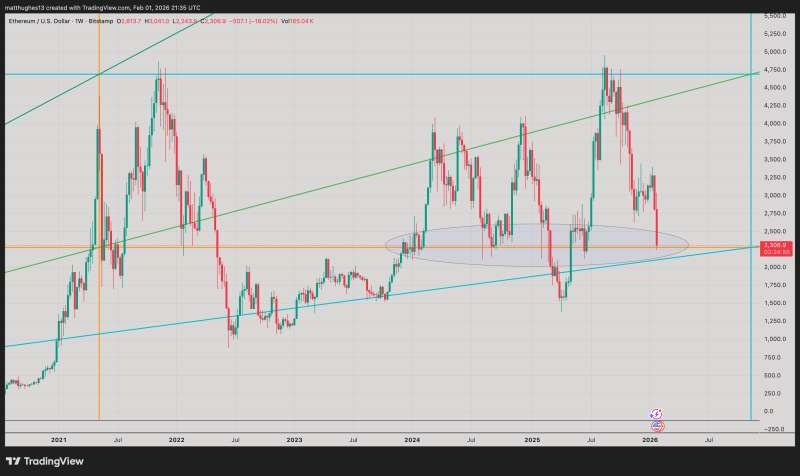
⬤ The weekly chart reveals a broader ascending pattern that's remained solid since the 2022 bottom. Each time price has tested or briefly dipped below this orange support zone over the past two years, buyers have stepped in and pushed ETH toward the upper channel boundary between $4,500 and $4,800.
⬤ Despite the sharp pullback, Ethereum hasn't broken its long-term rising support line yet. The extended sideways action around this level shows serious accumulation happening, with buyers consistently protecting the zone while sellers struggle to push through.
⬤ What happens here matters for the entire crypto market since Ethereum often sets the tone for broader sentiment. If this support holds, it reinforces the multi-year accumulation story. But a clean break below would flip the technical picture entirely. With ETH camping out at this level longer than usual, all eyes are on whether this zone continues calling the shots for the next big price swing.
 Alex Dudov


