 Peter Smith

⬤ Ethereum showed a classic liquidity trap - the price first ran through the upper zone then through the lower zone, all within a short span. Late buyers who entered near the top lost their positions - shorts were lured in at the bottom - stops were taken at multiple levels - then the structure reset. ETH has traded between about $2800 and $3200 and the heatmap displays both sweeps clearly.
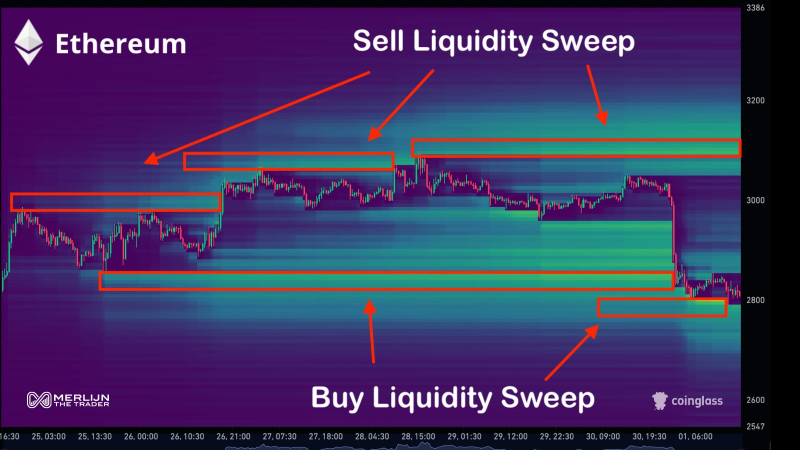
⬤ The chart records repeated sell side sweeps close to $3200. Price moved into overhead liquidity then flipped back each time. Each sweep hit a thick cluster of resting supply visible on the heatmap. Under that level a buy side sweep occurred near $2800: ETH dropped into deep liquidity then rebounded.
⬤ Such liquidity harvesting is routine - market makers knock out stops above and below before they choose the next direction. The heatmap reveals heavy absorption at each marked level. The quick switch from sell side sweeps near $3200 to buy side sweeps near $2800 completes a full cycle - ETH now rests near the lower band as the next phase starts.
⬤ The broader ETH market should note that sweeps of this kind often precede a larger move once both sides stand empty. With both ends of the recent range now swept, traders look for a volatility jump. Whether the next step is up or down, the removal of those pockets marks a structural shift - the coming sessions may set the tone for the wider crypto market.
 Peter Smith


