 Artem Voloskovets

⬤ Ethereum appears to be forming what analysts are calling a near-perfect Wyckoff re-accumulation pattern. The current market structure is hitting all the classic phases—Preliminary Support, Buying Climax, Upthrust in Phase B, Spring, Test, and now the Last Point of Support. If this setup continues to follow the traditional Wyckoff playbook, ETH could be positioned for a strong upward push, with projections pointing toward a potential target above $7,000.
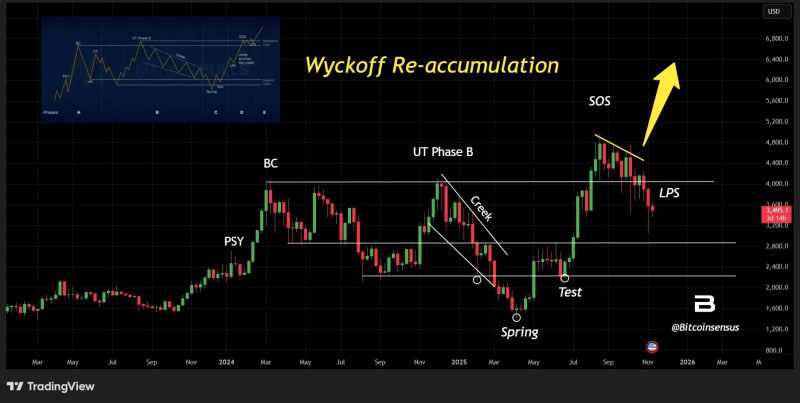
⬤ Of course, pattern-based forecasts aren't guarantees. While Wyckoff re-accumulation structures often lead to solid bullish moves, things can fall apart if key support levels don't hold. Ethereum is currently sitting within critical support and resistance zones, and volatility could spike as the pattern matures. If the structure breaks down instead of breaking out, the bullish case weakens significantly.
⬤ The chart comparison shows each phase lining up cleanly—the Creek, Spring, Test, and an emerging Sign of Strength. The alignment between Ethereum's actual price action and the textbook Wyckoff model is unusually tight, which is why some analysts are feeling confident about the upper target zone above $7,000. The key now is whether ETH can confirm the breakout with conviction.
⬤ For traders and investors, Wyckoff re-accumulation patterns have historically signaled the continuation of major bullish trends. If Ethereum completes the Sign of Strength phase and breaks clearly above resistance, sentiment could shift in a big way. That said, technical models don't come with guarantees—keeping an eye on support levels is crucial. Still, this potential setup has drawn a lot of attention and renewed interest in where Ethereum might be headed over the next few months.
 Artem Voloskovets


