 Usman Salis

⬤ Ethereum is showing early signs of a major inverse head and shoulders pattern on the weekly timeframe. The structure includes a well-defined left shoulder, head, and right shoulder, all sitting below a long-term neckline resistance that's been holding price down for months. This neckline acts as a multi-touch upper boundary that ETH hasn't broken through decisively yet.
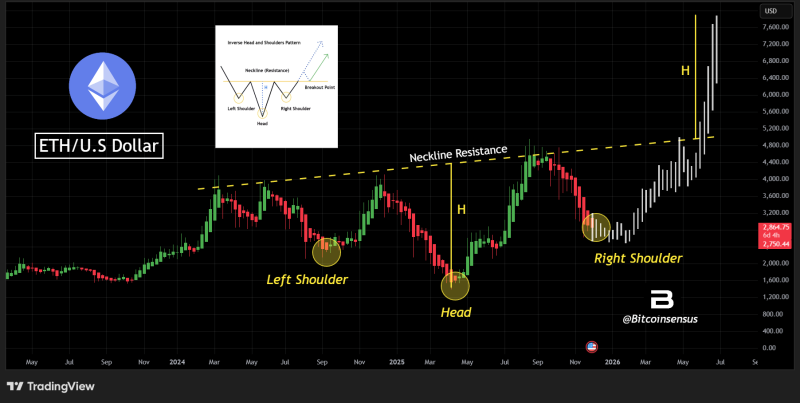
⬤ Each component of the pattern is visible on the weekly candles, with the head forming around the $2,000 zone earlier this year and the shoulders developing during separate pullback phases. The neckline stretches upward from previous highs near $4,800, marking the key breakout level to watch. Recent strong weekly candles suggest momentum is building again.
⬤ The symmetry of this formation is particularly noteworthy, as it's often seen as supportive for continuation patterns on higher timeframes. Weekly price action shows consistent recovery from the head level and steady right-shoulder development around $2,800 to $3,200. ETH has tested the neckline multiple times, with each rejection adding to the broader consolidation pattern.
⬤ A confirmed breakout above the neckline would complete one of the strongest bullish reversal patterns in classical technical analysis. For the broader crypto market, this could shift long-term sentiment, support higher-timeframe momentum, and potentially influence capital flows across major digital assets. Whether Ethereum can hold strength around these key levels will determine if this pattern leads to a significant trend continuation in the coming months.
 Usman Salis


