 Saad Ullah

⬤ Ethereum (ETH) is holding steady at two critical support levels based on fresh cost-basis distribution data. Big clusters of accumulated tokens have formed around $3,150 and $2,800, making these price zones particularly important right now. The Glassnode heatmap shows exactly where supply is stacked up across different price points, giving us a clear picture of where massive amounts of ETH last changed hands.
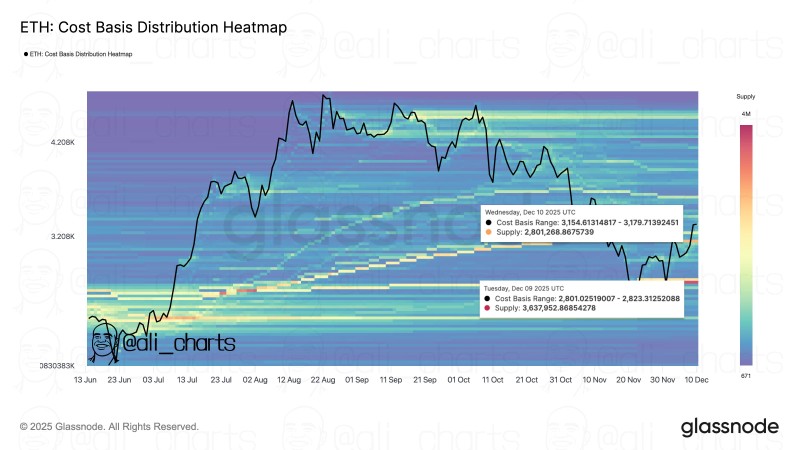
⬤ The chart lays out Ethereum's long-term price action next to a color-coded heatmap that shows cost basis concentration. On December 10, there's a highlighted band showing ETH accumulated between roughly $3,154 and $3,179, totaling about 2.8 million tokens. Just below that, another cluster from December 9 sits between approximately $2,801 and $2,823 with even more volume - around 3.6 million tokens. These accumulation zones pop out as thicker horizontal bands on the heatmap, clearly visible against the lighter surrounding areas.
⬤ Looking at Ethereum's recent price movement, you can see it interacting with these zones multiple times. These cost-basis clusters tend to line up with spots where the market gets really active during pullbacks or sideways trading. The chart shows ETH ripping higher through mid-year before settling into choppier action, touching these cost-basis bands repeatedly. The spread of tokens around these ranges tells us a lot of holders jumped in during these windows, creating natural zones of interest.
⬤ Why do these levels matter? Areas packed with accumulated tokens often shape what happens next, especially when volatility picks up or trends shift direction. When millions of tokens share similar entry prices, those zones naturally pull in liquidity and create structural floors in the market. Ethereum's current position relative to these clusters gives traders important context about how on-chain activity is driving sentiment and price action right now.
 Saad Ullah


