 Usman Salis

Ethereum (ETH) has entered a decisive phase on the monthly timeframe. After printing a higher high four months ago, ETH is now pulling back toward a key support area that may determine whether its broader bullish structure remains intact.
ETH Monthly Chart: Testing Tenkan–Kijun Support Around $3,169
Trader Cantonese Cat highlighted this development as ETH trades near the monthly Tenkan-sen and Kijun-sen, both converging around $3,169. This zone often acts as dynamic support on higher timeframes. Ethereum printed a higher high earlier in the year, and the current pullback is shaping what could become a higher low—a classic marker of bullish continuation.
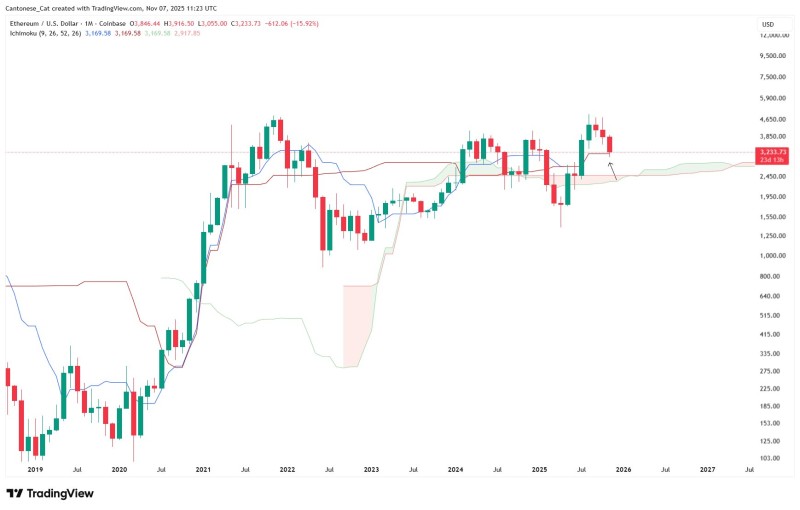
ETH remains well above the monthly Kumo (cloud), which continues to slope gently upward. Historically, ETH rallies tend to sustain when price stays above the cloud on high timeframes. The chart also shows ETH drifting into a price zone that acted as support in late 2024 and early 2025.
Why Ethereum Is Pulling Back Now
Several market dynamics contribute to ETH's current test of support. The recent decline resembles a typical monthly retracement rather than a trend reversal. Capital rotation toward Bitcoin may temporarily suppress ETH momentum, while the market awaits ETH-specific catalysts like L2 scaling improvements and staking upgrades. Traditional risk assets have also shown increased volatility, pulling crypto markets with them.
Key Levels to Watch
Primary support sits at the Tenkan and Kijun confluence around $3,169, with secondary support from $3,050 to $3,200. Immediate resistance appears near $3,800–$3,900, while a break above $4,000 would signal trend continuation. Below current levels, cloud support extends from $2,700 to $2,900. A confirmed higher low at current levels would strengthen ETH's bullish structure.
 Usman Salis


