 Usman Salis

⬤ Ethereum has now traded through most of the sell orders that sat below the market - the force that was pressing the price downward has largely gone. The order book shows that the bulk of immediate supply has been absorbed - the risk of a quick drop is now smaller because there are far fewer bids stacked beneath the current level, while thicker groups of orders still wait above.
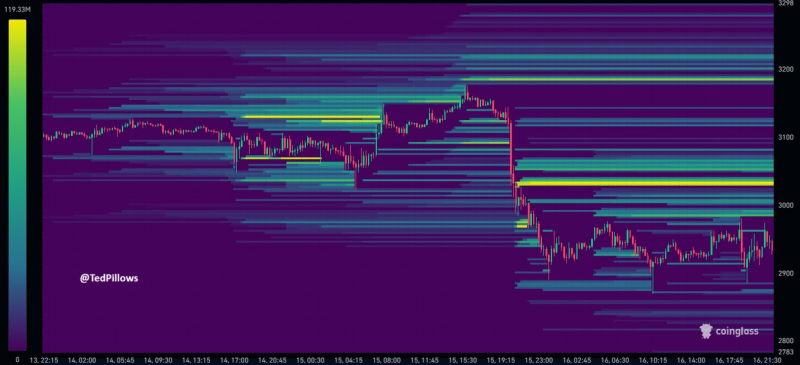
⬤ After the sharp fall, ETH entered a wide sideways band and now ricochets between levels where orders once gave support. The heatmap confirms that the old downside liquidity has already been executed, which removes much of the downward drag. As a result the zone that would hurt the largest number of leveraged traders has shifted a little higher - price now sits nearer to the remaining clusters of orders overhead than to those below.
⬤ Yet buying zeal is absent. Moves are small and lack the steady sign of spot accumulation that would power a durable rise. Action is mostly responsive - the location of resting orders dictates the next few steps instead of real directional strength. Traders appear guarded and let price drift inside a tight corridor.
⬤ With the downside liquidity largely gone, Ethereum is more exposed to sudden upward spikes if market makers decide to tag the remaining pockets of orders above. Conditions like this can produce sharp moves even when no strong trend conviction exists. Because most of the supply below has been cleared, a brief squeeze upward is possible if price is steered into the liquidity still waiting overhead - something already observed earlier this month. At the same time tepid demand raises the probability that choppy, range bound trade will continue rather than a clean breakout in either direction.
 Usman Salis


