 Saad Ullah

⬤ Dogecoin is catching eyes again on the weekly timeframe as a fresh double bottom pattern takes shape. The latest DOGEUSD chart shows price trying to find solid ground after a long slide downward. This isn't the first time we've seen this setup - the chart highlights a similar double bottom that played out earlier, showing how price loves to test the same support zone twice before deciding where to go next.
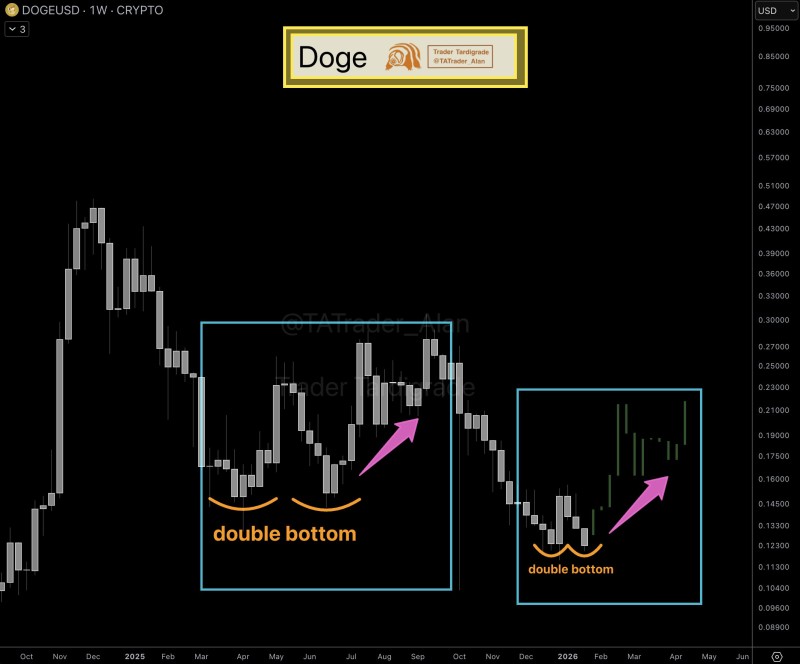
⬤ Looking at the chart, you can spot two clear bottoming phases happening in the same price neighborhood. Each time, DOGE dropped into support, bounced back up, then came back down to retest those lows before showing any real strength. The boxed areas on the chart make it easy to see how these patterns developed over weeks and months - this is definitely a weekly timeframe story, not something you'd catch on the daily charts.g.
⬤ What happened last time is pretty interesting. When the first double bottom finished forming, DOGE pushed higher in a meaningful way - you can see that recovery move clearly marked on the left side of the chart. Now the current setup on the right looks remarkably similar: price is squeezed tight near the lows, and we're starting to see some bigger green candles appear. Nothing's confirmed yet, but when you see the same pattern showing up twice, it's worth paying attention to.
⬤ This matters beyond just DOGE itself. When you get these kinds of patterns appearing on weekly charts for major coins, it often shifts how people feel about the broader crypto market. A double bottom on this timeframe could signal DOGE is transitioning from falling to holding steady - but only if price actually stays above those recent lows. Whether history repeats itself here remains to be seen, but the familiar structure definitely puts Dogecoin back on the radar for anyone tracking longer-term trends.
 Saad Ullah


