 Victoria Bazir

Dogecoin (DOGE) has captured traders' attention once more as its weekly chart reveals a formation remarkably similar to patterns that came before its last explosive rally. Despite recent pullbacks, the technical structure hints that DOGE might be gearing up for another upward push if critical support zones remain intact.
A Repeating Pattern Worth Noting
Recent analysis from Trader Tardigrade highlights how Dogecoin's current chart mirrors earlier setups where apparent breakdowns actually set the stage for powerful rallies.
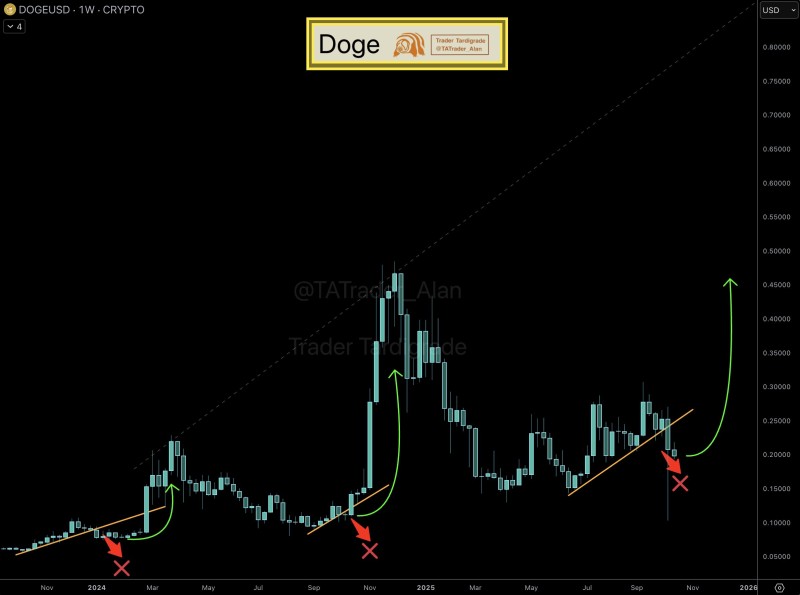
The pattern includes:
- Several false breakdown signals (marked with red crosses) that initially looked bearish
- Sharp reversals following these signals that led to steep climbs
- The latest test of trendline support acting as a potential reset before a larger move
If this fractal plays out as before, Dogecoin could push toward the $0.40–$0.45 range, nearly doubling from current price levels.
Key Technical Levels to Monitor
There's critical support sitting around $0.15–$0.17, where buyers have historically shown up with strong volume. The immediate hurdle lies near $0.25, aligned with the broken trendline - reclaiming this area would likely signal renewed momentum. If DOGE holds its structure, the chart points to potential upside toward $0.45 over the medium term.
Market Dynamics Behind the Outlook
Several broader factors could influence this setup. Fresh speculation in meme coins is building as liquidity flows back into altcoins. Retail enthusiasm remains strong thanks to Dogecoin's unique cultural status. There are also recurring hints about possible future integrations with platforms like X, often connected to Elon Musk's sentiment-driving influence. These elements could provide the spark Dogecoin needs to follow its historical pattern of sudden surges.
 Victoria Bazir


