 Marina Lyubimova

⬤ Dogecoin recently dropped to a key technical level following a prolonged pullback. DOGE wicked down to the 0.786 Fibonacci retracement level near $0.10, matching the same support zone seen during the August 2024 low.
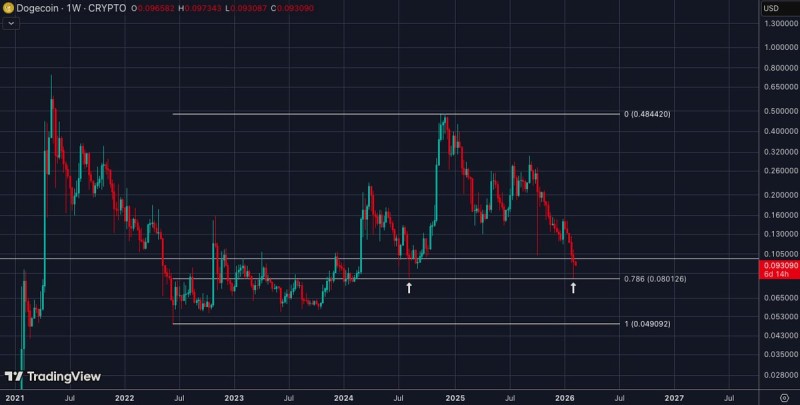
⬤ The weekly chart shows price approaching the $0.093–$0.10 range, where buyers previously stepped in and reversed the downside momentum. This zone now serves as a critical reference point for traders watching whether the asset holds or breaks lower. Similar patterns appeared in Dogecoin Breaks Wedge Pattern With MACD Bullish Crossover at $0.09-$0.10 and the accumulation behavior described in Dogecoin Whales Accumulate as Price Approaches $0.30.
⬤ Historically, Dogecoin has shown strong reactions near deep retracement levels after extended corrections. The current market structure suggests the asset remains within a broader consolidation range, with multiple bounces occurring from similar zones in past cycles. As one analyst noted, "This level has proven to be a turning point multiple times before." Comparable setups were also discussed in Dogecoin Shows Familiar Setup Ahead of Potential Rally, where repeated support tests preceded major volatility.
⬤ What happens next depends entirely on whether this level holds. A successful defense could establish a solid base and restore bullish momentum, while a breakdown would open the door to deeper losses and shift sentiment across the meme coin sector. With whales accumulating and technical indicators aligning, the coming days could prove decisive for Dogecoin's near-term direction.
 Marina Lyubimova


