Saad Ullah

Dogecoin (DOGE) appears ready for another explosive move. The monthly chart shows the meme coin breaking out of an extended downtrend, with technical indicators suggesting the start of a new parabolic phase. DOGE's current price action mirrors the early patterns from its legendary 2017 and 2021 bull runs.
DOGE Long-Term Chart Analysis
The monthly DOGE/USDT chart reveals a recurring pattern: lengthy consolidation periods beneath descending resistance lines, followed by explosive vertical rallies.
Tesla Model Ðoge traders are watching these developments as the chart tells a compelling story.
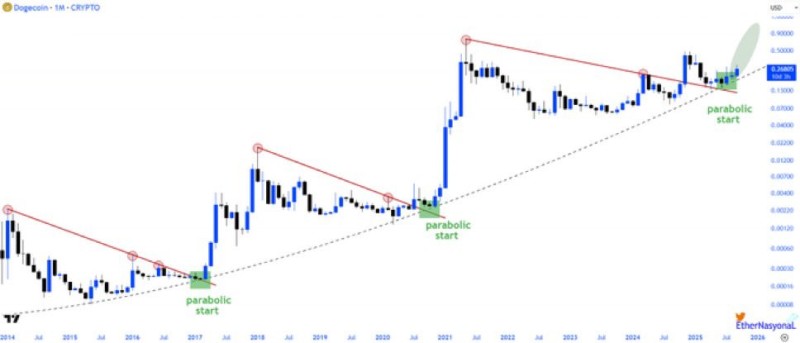
Each cycle starts with prolonged downtrends marked by red resistance boundaries. The parabolic launches in 2017, 2021, and potentially now in 2025 triggered massive momentum once DOGE reclaimed trendline support. Currently, DOGE is breaking above its latest descending trendline, consolidating around $0.20–$0.25, with another "parabolic start" formation emerging.
Market Drivers Supporting the Setup
Several factors support this technical breakout. Every previous breakout from this pattern has delivered exponential gains. With Bitcoin stabilizing, speculative capital often rotates into meme coins like DOGE. Additionally, Dogecoin remains highly recognized, making it sensitive to retail enthusiasm and social media hype.
Price Targets and Critical Levels
Key levels ahead include first resistance at $0.35–$0.40 and the psychological $0.50 barrier. If momentum mirrors earlier cycles, long-term targets reach $0.75–$1.00. However, the $0.15–$0.18 support zone remains critical - any breakdown could invalidate the bullish setup.
 Saad Ullah