 Peter Smith

⬤ Dogecoin is consolidating within an ascending triangle on the 4-hour DOGEUSDT chart, showing a clear pause after recent price swings. The pattern reveals a series of higher lows forming along a rising trendline, while the upside keeps hitting a wall near the same horizontal resistance level. This setup has traders wondering if DOGE might be putting in a short-term bottom.
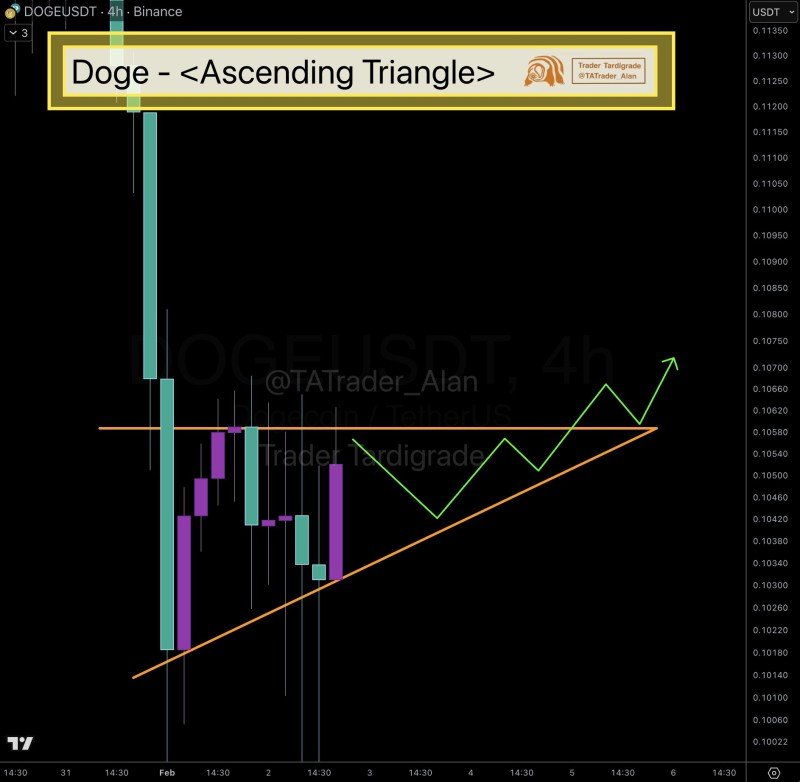
⬤ After bouncing back from a sharp selloff, DOGE has been holding above the ascending support line. Each pullback continues to respect this rising trendline, showing that buyers are stepping in at higher and higher prices. Meanwhile, multiple attempts to break above resistance have failed, creating the narrowing triangle shape. This compression shows indecision rather than a confirmed trend.
⬤ Right now, Dogecoin is trading just above rising support near $0.103, with resistance still holding around the mid-$0.105 area. As one analyst noted, "the structure raises the question of whether Dogecoin is in the process of establishing a short-term bottom." The gap between support and resistance keeps shrinking, suggesting price is coiling up as the pattern develops. The chart shows continued back-and-forth movement within the triangle rather than a clear breakout direction.
⬤ This matters for the broader crypto market because Dogecoin tends to grab attention when price action tightens up like this. Patterns like ascending triangles often lead to increased volatility once price finally breaks out of the established range. With DOGE compressing near a key technical level on the 4-hour chart, what happens next could influence short-term sentiment across meme coins and the wider crypto space.
 Peter Smith


