 Saad Ullah

⬤ Dogecoin is trading with its weekly Price Momentum Oscillator near the same historic lows that appeared before previous major rallies. The DOGE/USD chart reveals these momentum conditions have only shown up a handful of times over the past decade, and each time they coincided with long consolidation periods right before explosive price moves.
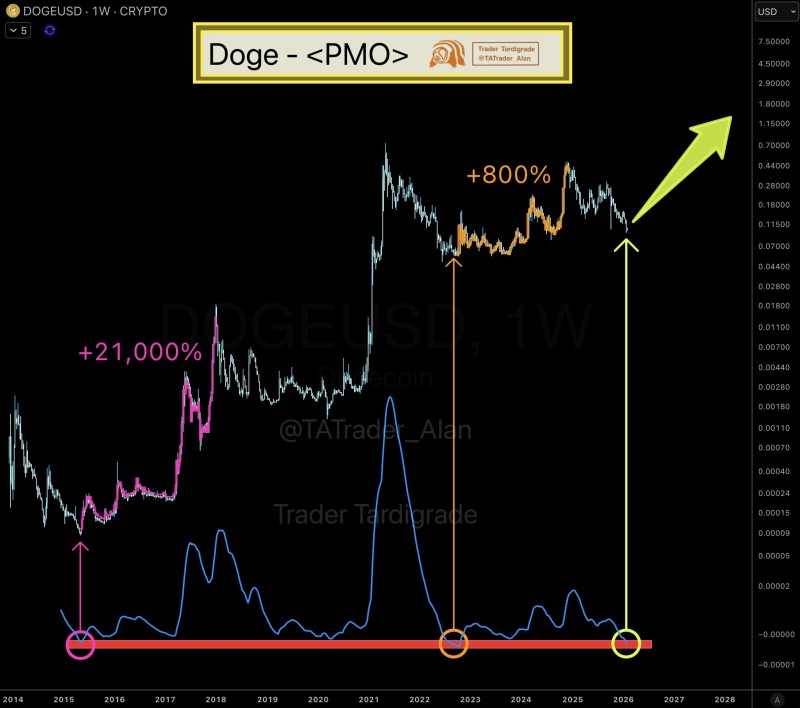
⬤ The pattern has played out twice before with remarkable results. From 2015 to 2018, Dogecoin exploded roughly 21,000% after the PMO hit similar lows and started stabilizing. The setup repeated around 2022, leading to an 800% climb into 2024. Both times, the price sat quietly while momentum compressed at the bottom before suddenly shifting into powerful uptrends.
⬤ Right now, Dogecoin is consolidating after its latest rally, with the PMO sitting in that same long-term support zone from previous cycle bottoms. These momentum patterns take time to develop—often months of sideways movement before any real trend kicks in. The focus here is on structural similarities, not predicting exactly when or how big the next move might be.
⬤ What makes this relevant beyond Dogecoin is its historical role as a sentiment gauge for speculative crypto cycles. When these momentum structures repeat, they tend to shift expectations around volatility and participation across the broader digital asset market. With the PMO once again at levels tied to past cycle shifts, this consolidation phase highlights how momentum resets have consistently shaped Dogecoin's long-term price behavior.
 Saad Ullah


