 Usman Salis
Dogecoin (DOGE) continues trading within a well-defined triangle pattern on the weekly timeframe, catching the attention of technical analysts across crypto markets.
Chart Breakdown
According to analyst Trader Tardigrade, this consolidation structure remains intact and could signal an upcoming volatile move. Historically, DOGE has delivered explosive rallies after extended periods of compression, making the current setup particularly interesting for traders watching meme coin momentum.
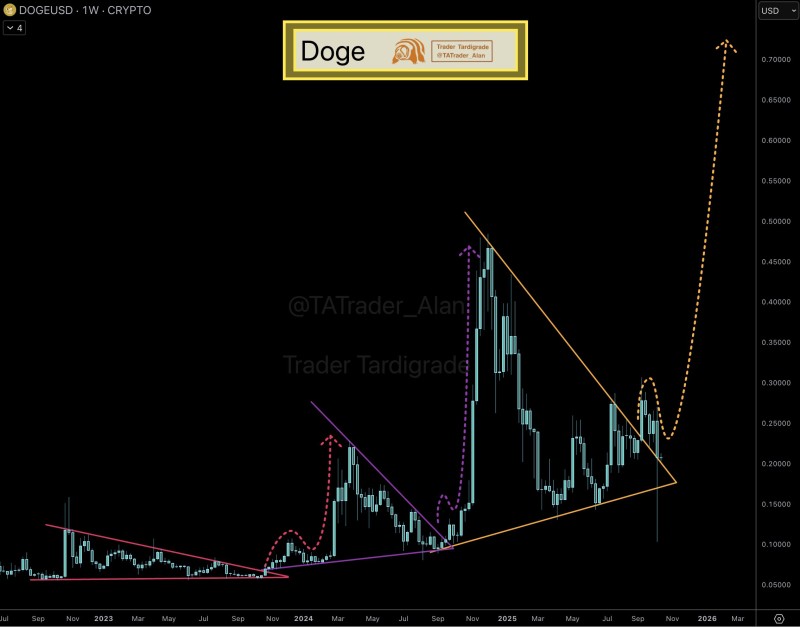
The weekly DOGE/USD chart shows price squeezed between converging trendlines—a classic triangle formation that typically precedes expansion in volatility. Key levels include:
- Triangle boundaries: Price action compressed between converging support and resistance lines, with each swing creating tighter ranges
- Support holding: The $0.15–$0.20 zone has proven resilient, with buyers consistently stepping in at these levels
- Resistance target: The upper triangle boundary around $0.30 represents the critical breakout threshold bulls need to reclaim
- Measured projection: A clean breakout could theoretically push DOGE toward $0.70, revisiting levels from the previous cycle's peak
Past examples from 2021 and early 2024 demonstrate that similar triangle consolidations preceded sharp upward moves, lending credibility to the pattern's predictive value.
Market Context
Despite ongoing uncertainty in broader crypto markets, Dogecoin's ability to hold this structure stands out. With meme coins seeing renewed attention and liquidity beginning to rotate back into altcoins, DOGE could reassert itself as the sector's leader if bullish conditions materialize. The coin's strong community and name recognition continue giving it an edge when retail interest picks up.
Right now, DOGE remains coiled inside the triangle, and the smart play is patience. A decisive break above $0.30 would likely trigger momentum toward $0.50 and potentially $0.70. However, losing support below $0.15 would break the bullish structure and warrant a more cautious stance. Until then, traders are watching closely for volume spikes and clean candle closes outside the pattern boundaries.
 Usman Salis


