 Saad Ullah

Dogecoin has reached a critical technical point that could shape its next big move. The chart comparison reveals striking similarities, sparking speculation about another parabolic rally ahead.
Key Technical Signals
Analyst Trader Tardigrade recently highlighted that $DOGE is repeating a historical price pattern that previously triggered a massive surge. Symmetrical Triangle Formation: Like in 2023, Dogecoin has been consolidating within a large descending triangle—a pattern that often comes before major breakouts when momentum builds up.
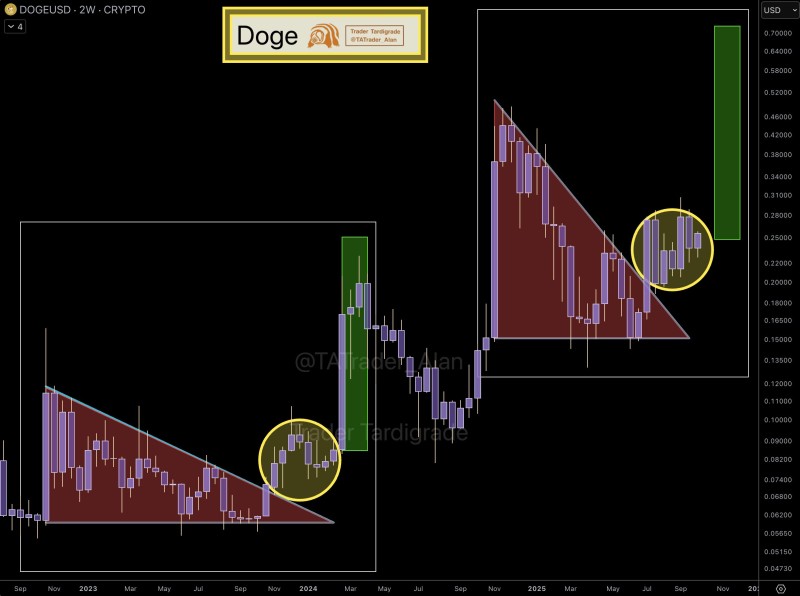
Breakout Setup: The chart shows price action clustering in familiar zones before previous rallies. The late 2023 setup resulted in a sharp surge, and the current formation looks remarkably similar.
Projected Target: Technical analysis suggests a potential breakout rally toward the $0.60–$0.70 range, which would represent gains exceeding 200% from current levels. This pattern strongly supports the bullish outlook for a significant Dogecoin surge.
Why This Rally Could Happen
The technical repetition is compelling—the chart structure closely matches a proven bullish setup that delivered explosive gains before. With crypto sentiment turning positive and liquidity flowing back into the market, meme coins like Dogecoin typically attract strong speculative interest. Despite being a meme coin, Dogecoin maintains one of crypto's strongest communities, and retail hype often acts as a powerful catalyst during bull phases.
Traders should watch these critical levels: support sits around $0.20–$0.22 as the crucial base, while a sustained move above $0.30 would confirm bullish momentum. The upside targets range from $0.60 to $0.70, based on historical patterns.
 Saad Ullah


