Eseandre Mordi

⬤ Dogecoin's weekly chart has caught attention by mapping out a structured long-term scenario based on past price cycles and ascending channels. The analysis frames DOGE's potential future movement through historical patterns rather than making short-term calls. The chart's creator emphasizes this is purely a planning scenario that needs market confirmation before it can be validated.
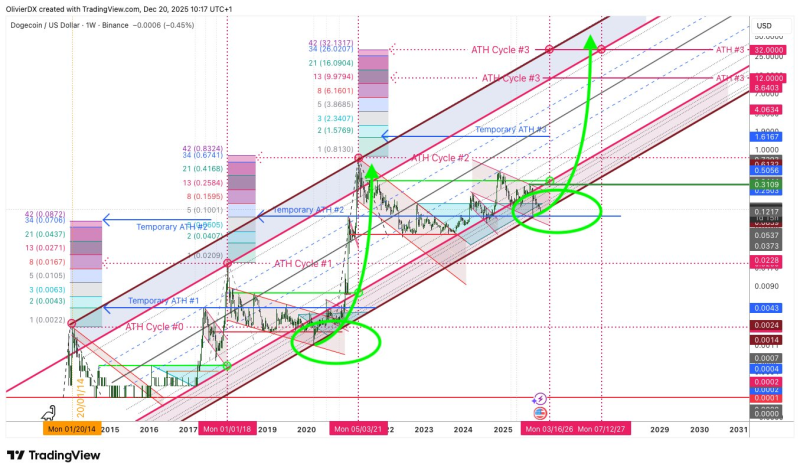
⬤ The weekly timeframe reveals multiple historical cycle phases moving from consolidation into strong expansions within a rising channel. Previous cycles showed temporary peaks followed by corrections before continuing higher. The chart projects similar potential paths using trend channels and cycle markers, showing how DOGE might behave if history repeats itself.
⬤ Consolidation zones appear repeatedly throughout DOGE's history, marking periods where price stabilized near channel support before accelerating upward. These zones suggest structural repetition rather than random movement. The chart uses proportional extensions and cycle counts as guiding frameworks, not exact predictions. Current price action stays within the broader channel and below projected peaks, keeping the entire scenario conditional.
⬤ This analysis matters because it puts Dogecoin into a long-term structural context instead of focusing on short-term hype or volatility. By clearly stating the plan is just a scenario, it highlights both the uncertainty involved and a methodical way to read DOGE's past behavior. Whether this path plays out depends entirely on future price action, overall crypto market conditions, and liquidity trends.
 Eseandre Mordi