 Artem Voloskovets
Cardano ($ADA) is showing early signs of a serious long-term recovery after spending over two years consolidating.
Technical Overview: ADA Eyes $5–$7 on Fibonacci Expansion
In a recent post, The DApp ₳nalyst made a bold statement: if you like ADA at $0.67, you'll "love it between $5 and $7" within the next 6 to 12 months. Looking at the chart, there's real technical support backing that idea—potentially setting up a major upside cycle heading into 2025–2026.
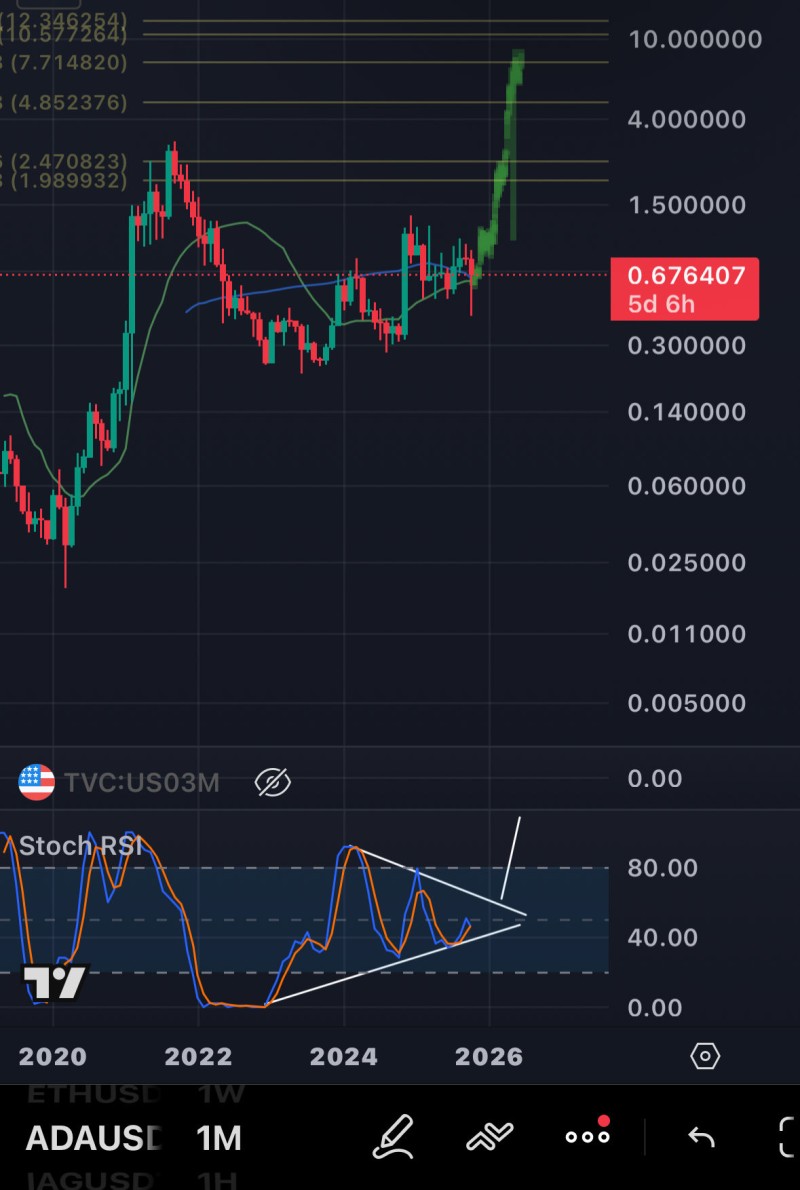
The monthly chart for ADA/USDT shows Cardano bouncing back from long-term support around $0.25–$0.30 and consistently making higher lows since early 2023. Currently trading near $0.67 and sitting above key moving averages, ADA looks like it's building momentum for a trend reversal. Here's what stands out:
- Bullish Stochastic RSI signal: The indicator shows a multi-year bullish setup with both lines rising and converging—historically a precursor to strong moves up.
- Higher lows since 2023: ADA has been building an ascending structure that's typical of long-term reversals.
- Fibonacci targets: The chart points to major levels at $1.98, $2.47, $4.85, $7.71, and $10.34—right in line with the $5–$7 forecast.
- Momentum returning: After months of tight consolidation, volatility is picking up again, hinting that ADA might be entering an acceleration phase similar to the 2020–2021 rally.
If this momentum holds, the first stop is around $2.00, with potential extensions toward $5–$7 in the next market cycle.
Beyond technical patterns, several real-world factors support ADA's bullish case. Cardano's DeFi and smart-contract ecosystem continues to grow, with rising on-chain activity and developer engagement throughout 2025. Its proof-of-stake model is attracting institutional interest focused on sustainability. Plus, as Bitcoin stabilizes, capital historically rotates into strong Layer-1 projects like ADA during altcoin seasons. Improved regulatory clarity has also boosted confidence in quality protocols. Together, these factors could fuel ADA's next growth phase.
History Rhyming: The 2020 Setup Returns
The current chart looks eerily similar to ADA's 2019–2020 accumulation period, which came right before its breakout past $3.00 in 2021. Once again, ADA has spent months building a solid base beneath major resistance. The rising Stochastic RSI mirrors what we saw just before the last parabolic move—suggesting history might be repeating itself.
The Fibonacci framework maps out a realistic path for ADA's next rally. An initial push toward $1.98–$2.47 would mark the first expansion phase. Breaking above $4.85 could confirm entry into the upper zone between $7.00 and $10.00. While ambitious, this aligns with ADA's historical volatility and market cycles. If crypto markets stay bullish, these targets could be within reach by late 2025 or early 2026.
 Artem Voloskovets


