 Alex Dudov
As weekend trading unfolds, Cardano (ADA) is testing what could be a major technical turning point. The cryptocurrency has edged above its descending resistance line on the 4-hour chart, hinting at renewed bullish momentum. But Sunday's thin trading activity could make this early move deceptive until volume picks up.
Technical Setup Points to Potential Reversal
The chart shows a well-defined inverse head and shoulders pattern, according to trader Sssebi — a classic signal often seen at the end of downtrends. The pattern's three clear troughs (left shoulder, head, and right shoulder) reflect a gradual shift from sellers to buyers. Price has now climbed above the blue descending trendline, hovering around $0.662 and marking the neckline of the formation. Yet this move happens under low-volume conditions, making it vulnerable to sudden reversals once liquidity returns during weekday sessions.
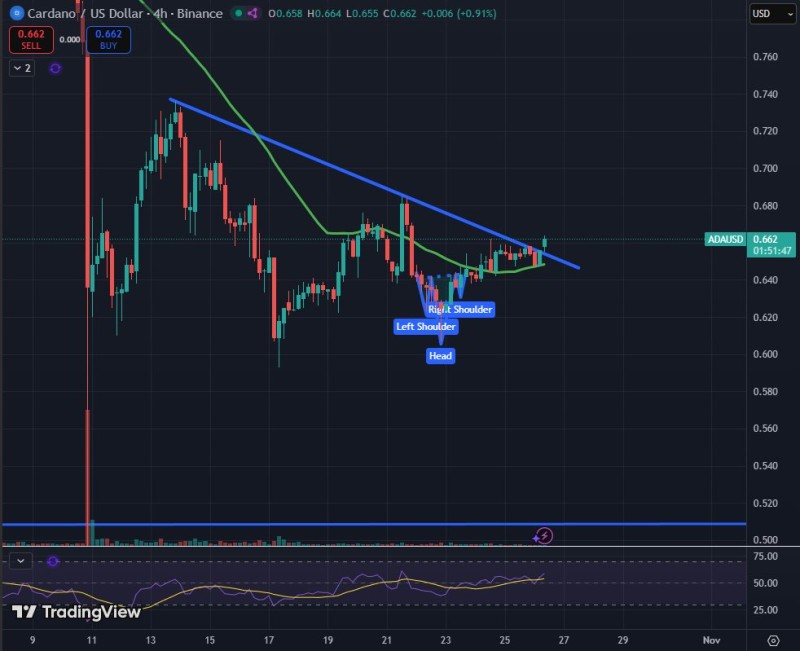
Momentum indicators support cautious optimism. The RSI is climbing from mid-range levels, showing that buying pressure is slowly building without entering overbought territory. Meanwhile, the 50-period moving average is starting to flatten, suggesting that downside momentum is fading.
What Needs to Happen Next
For ADA to confirm a real reversal, price must hold above $0.66 and set a higher high above $0.68–$0.70, an area that previously triggered multiple rejections. A successful retest of this zone on rising volume could open the path toward $0.74, where the next resistance sits. On the flip side, if ADA fails to maintain this structure, it risks dropping back to $0.63, where buyers previously stepped in.
The critical takeaway is straightforward: technical signals need confirmation through volume and liquidity before they can be trusted, especially on weekends. If this setup holds into early next week, it could mark the start of a trend reversal for Cardano, ending weeks of sideways action and potentially signaling a broader altcoin recovery phase.
 Alex Dudov


