 Usman Salis

Bitcoin's largest holders are stirring again. The Santiment chart reveals a synchronized rise in both Bitcoin's price and large-transaction volume, a pattern that historically appears before major market moves.
This uptick in whale activity could signal fresh institutional interest and may be laying the groundwork for Bitcoin's next volatility phase.
Whale Transactions Rebound as Market Momentum Builds
According to on-chain data shared by Ali, whale transactions exceeding $1 million have climbed to a two-month high of 6,311—a significant shift in network behavior. The chart clearly illustrates that whale transactions—shown as gray shaded blocks—have been climbing steadily since early October. As this activity intensified, Bitcoin's price (black line) followed with a modest recovery after a mid-month dip.
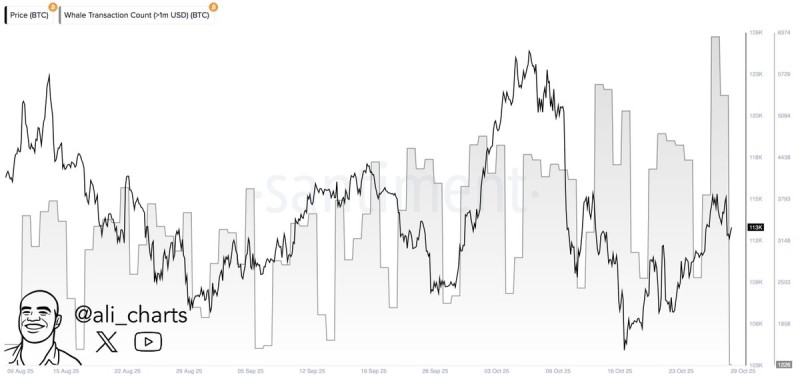
By late October, whale activity reached levels unseen since August, marking a sharp spike in high-value wallet movements. These kinds of transfers are typically read as smart money positioning—either accumulating ahead of a rally or redistributing near local peaks.
Key Takeaways:
- Two-Month Peak: Whale transactions (>$1M) hit 6,311, the highest since late August
- Price Correlation: Bitcoin rebounded alongside whale activity, suggesting coordinated accumulation
- Network Flow: Rising large transfers indicate renewed liquidity and re-engagement from institutions or major investors
- Historical Pattern: Similar surges in whale behavior have often preceded significant price swings
Why Are Bitcoin Whales Returning Now?
Several factors are driving this wave of large-scale activity. ETF optimism around potential U.S. spot Bitcoin ETF approval has rekindled institutional participation. Falling Treasury yields and growing risk appetite across global markets are pushing capital toward digital assets. On-chain metrics also show whales quietly accumulating BTC during pullbacks—a classic long-term confidence signal.
As Ali noted, sustained whale activity at this level often coincides with stronger network health and improving sentiment, especially when paired with lower exchange inflows and higher long-term holding patterns.
Bitcoin's chart suggests a textbook accumulation phase after a correction. Price action remains range-bound but is showing early signs of strength, with support around $27,000–$28,000 and resistance near $31,000–$32,000.
When large transaction counts rise during stable or strengthening prices, it usually reflects smart capital accumulation rather than speculative churn—a positive sign for long-term holders.
Notably, there are no major outflow spikes, meaning these whales aren't dumping—they're strategically moving capital on-chain, another bullish undercurrent.
 Usman Salis


