 Peter Smith

⬤ Bitcoin has crossed the 100 simple moving average, a level widely viewed as a structural boundary between bullish and bearish phases. This line historically acts as a regime divider rather than a routine technical indicator, marking where market conditions shift direction.
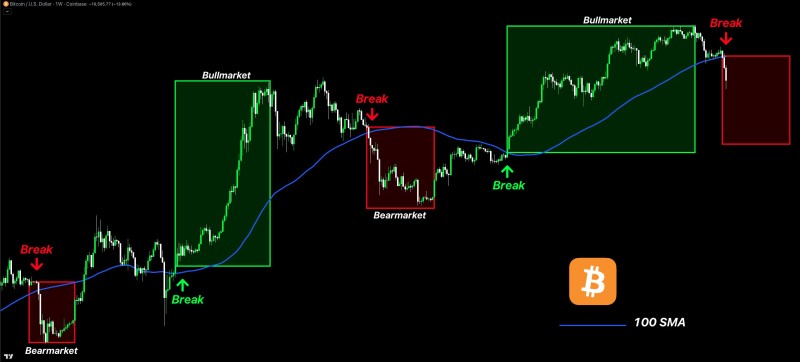
⬤ The chart highlights that previous Bitcoin bull markets developed while price stayed above the 100 SMA. During those periods, pullbacks were repeatedly bought and momentum expanded. In contrast, when Bitcoin traded below the same level, rallies tended to fail and broader market structure weakened. The recent move occurred after a prolonged compression phase, a setup often associated with expanding volatility once direction resolves.
⬤ The key focus now isn't the break itself but the reaction around the level. Holding above the 100 SMA would signal acceptance of higher value and continuation of constructive structure. A rejection would reflect weakening conditions, similar to earlier periods where price slipped back below the line and failed to sustain upward moves.
⬤ This area historically defines whether Bitcoin transitions into a stronger trend or returns to pressure. The reaction at the 100 SMA can influence sentiment and market behavior beyond a single timeframe, making it a structural point of attention across the broader crypto market.
 Peter Smith


