 Artem Voloskovets

After days of sharp selling, Bitcoin seems to be catching its breath. What's catching traders' attention now is a tweezer bottom pattern forming on the daily chart, a classic signal that often marks the end of a downtrend and the beginning of a bounce.
The Technical Setup
The cryptocurrency found crucial support right around the $100,000 mark—a level that aligns perfectly with a Gann Square trendline tracked by analyst Cantonese Cat.
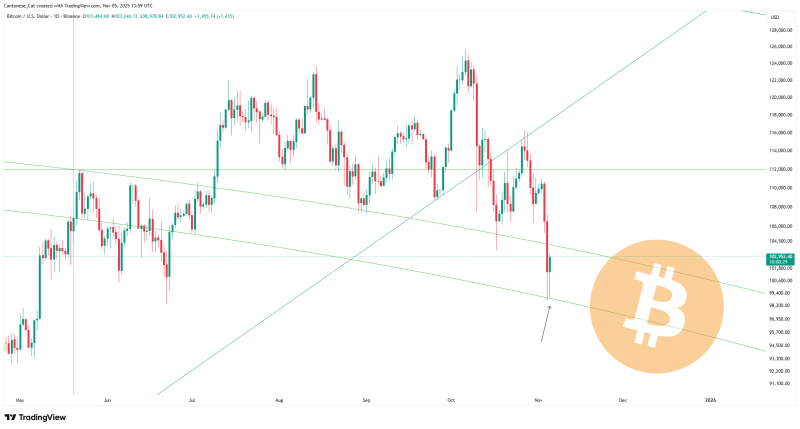
Bitcoin's recent dip below $99,000 landed precisely on the lower boundary of a long-term Gann channel—a dynamic support level that has previously triggered reversals during similar corrections. The Gann Square method, which combines time and price geometry, suggests the selling pressure may be exhausted at this level.
The tweezer bottom is the real kicker here: two consecutive daily candles with nearly identical lows signal that buyers are defending this price zone aggressively. If today's candle closes green, it would confirm buyer strength and potentially kick off a move higher.
Here are the key levels to watch:
- Support zone: $98,000–$100,000 (reinforced by the Gann arc)
- First resistance: Around $110,000 (a previously rejected level from October)
- Major resistance: $114,000–$116,000 (aligned with prior swing highs)
A clean break above $103,000 would strengthen the bullish case and open the door to $110,000. But if Bitcoin slips below $98,000, the next stop could be around $95,000, where another Gann line waits.
What's Next?
Despite recent volatility and profit-taking, Bitcoin's long-term structure looks healthy. The chart shows the price is still respecting its cyclical Gann arcs, and volume hasn't cratered—suggesting institutional players aren't bailing. Many are simply waiting for confirmation of a local bottom before jumping back in.
With the 2026 halving cycle on the horizon, dips like this tend to attract accumulation—just like in past pre-halving phases. The big question now is whether Bitcoin can close above $100,000 today and confirm the tweezer bottom. If it does, expect a relief rally toward $108,000–$110,000 in the coming days. Holding the Gann arc would signal this is just a technical correction, not a structural breakdown.
 Artem Voloskovets


