Peter Smith

Bitcoin's order book is flashing two critical levels that might dictate its next big move. A new liquidity heatmap from CoinGlass shows heavy buy-side interest stacking up around $90,000, while sell-side orders cluster near $126,000—right where Bitcoin's previous all-time high sits.
What the Heatmap Shows
On-chain analyst Ted suggests the current weakness could push BTC lower first, possibly filling the CME gap near $90K, before any meaningful bounce takes hold.
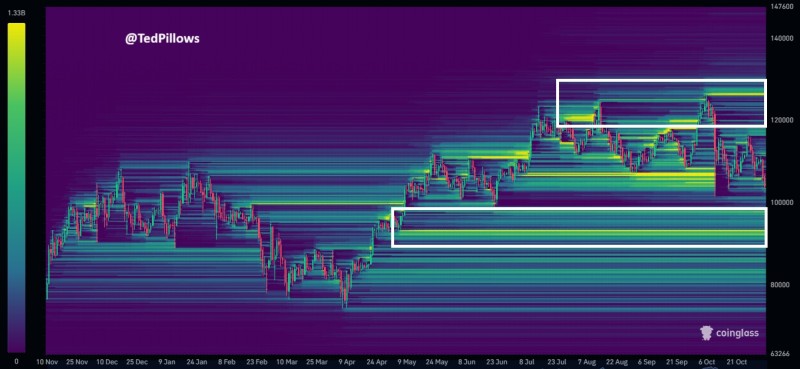
The CoinGlass visualization reveals where big traders have parked their orders, with brighter zones marking heavier liquidity:
- $90,000 support zone: A thick yellow band shows massive buy-side liquidity here, matching up with an unfilled CME futures gap. Bitcoin has a habit of filling these gaps before moving on, making this a likely target if the selling continues.
- $126,000 resistance cluster: Up top, another bright zone sits near Bitcoin's old ATH. This is where a lot of traders have set their take-profit orders, which could act as a ceiling once the next rally kicks in.
- Thin middle ground: Between these two levels, liquidity thins out—suggesting Bitcoin might trade in this range until one side gets absorbed.
Right now, the map shows more liquidity sitting below current prices than above, hinting that the market may need to dip and grab that downside liquidity before gearing up for a bigger move higher.
Why a Dip Could Come First
A few things point to Bitcoin potentially visiting $90K before pushing toward new highs. The CME gap remains a widely watched technical target that rarely stays unfilled for long. After months of strong gains, the market looks ready for a breather—giving leveraged positions time to reset. Add in slower ETF inflows and the natural tendency for price to hunt liquidity pools, and you've got a setup where a short-term pullback makes a lot of sense before the next leg up begins.
 Peter Smith