 Saad Ullah

⬤ Bitcoin is trading close to recent highs after pushing through an impulsive rally that formed a textbook five-wave pattern. The chart shows completion of this upward sequence, a corrective phase might be around the corner—especially if buying pressure fades near resistance. The key levels to watch are overhead barriers at $70,627 and $71,780, while losing $68,630 would likely kick off a pullback.
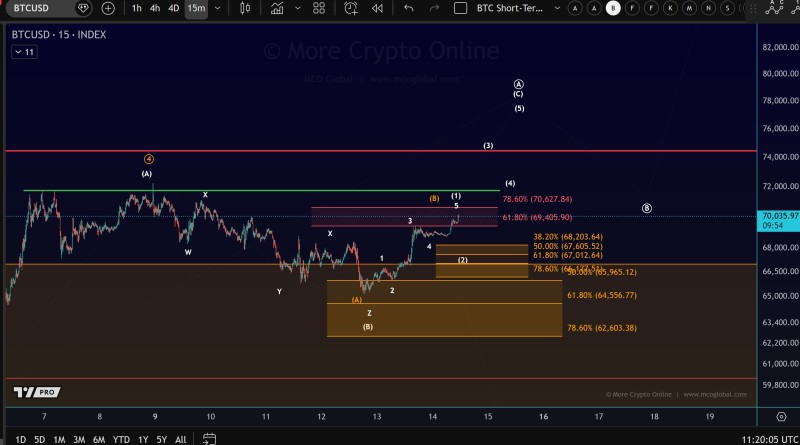
⬤ Right now, Bitcoin's climb has stalled just under resistance, showing that buyers are running out of steam after the fifth wave push. The structure points more toward consolidation than continuation. As the analyst noted, "the upper micro support zone will be adjusted until a clear local top forms in wave (1)." Traders are watching closely to see if price holds above support or starts sliding into correction mode. This matches what broader BTC price analysis reports are flagging—rejection risk around these same zones.
⬤ A breakdown below $68,630 would confirm a short-term pullback is underway. But if Bitcoin stays above that line, the bullish setup remains alive for another push toward resistance. The $70,600–$71,800 range is acting as the technical ceiling right now. Macro factors like regulatory updates and institutional moves covered in Bitcoin news are also shaping how traders position themselves at these levels.
⬤ This matters because Bitcoin is at a crossroads. Whether it breaks support or punches through resistance will decide if we're heading into correction territory or gearing up for another leg higher—and that'll set the tone for the wider crypto market in the days ahead.
 Saad Ullah


