 Saad Ullah

⬤ Bitcoin could be setting up for a classic bearish reversal. Recent technical analysis points to a head-and-shoulders pattern taking shape—one of the most well-known warning signs in trading. The chart shows Bitcoin might bounce back to around $112,000 to complete the right shoulder before testing the key $100,000 support level again.
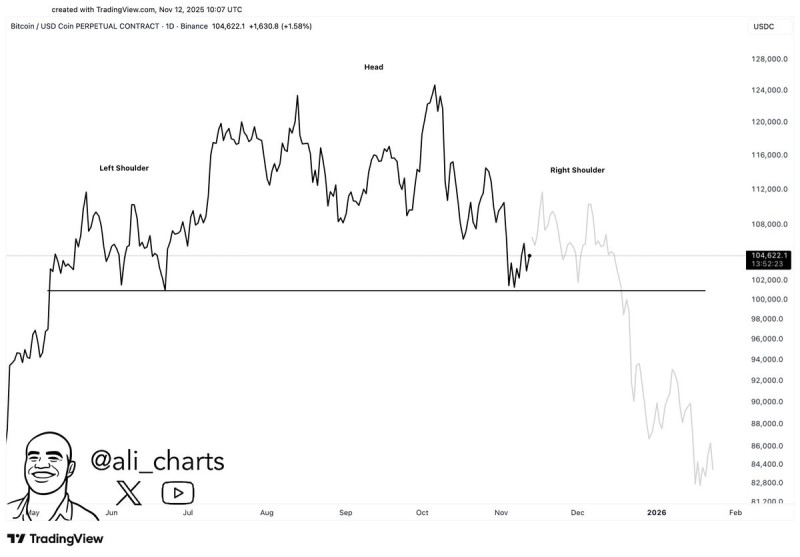
⬤ The pattern is pretty textbook: the left shoulder formed back in June, followed by a higher peak in September that marks the head. Since then, Bitcoin has been drifting lower toward that $100,000 neckline. If BTC can't hold that level and breaks down, the measured target sits at $83,000—a notable drop from the current price around $104,600. That target comes from the standard head-and-shoulders calculation: the distance from the head to the neckline, projected downward.
⬤ The analysis suggests bullish momentum is fading as sellers start gaining ground. A potential bounce to $112,000 could form the right shoulder before Bitcoin retests $100,000—and if that neckline breaks, $83,000 becomes the next stop.
⬤ For Bitcoin holders, this setup introduces real short-term risk after the strong gains earlier in 2025. The $100,000 level is now both a technical support zone and a psychological barrier. If Bitcoin pushes back above $112,000, the bearish pattern falls apart and confidence returns. But a confirmed breakdown could trigger heavier selling toward $83,000. With Bitcoin driving sentiment across the entire crypto market, traders are watching this level closely heading into 2026.
 Saad Ullah


