Peter Smith
After consolidating for weeks, Cardano (ADA) is drawing attention as it approaches $0.70—a critical threshold that could shape its trajectory for months ahead. This level isn't arbitrary. It lines up with the 50-week moving average, a technical marker that often separates bearish drift from bullish momentum. If ADA manages to close above it this week, we might be looking at a genuine shift in trend rather than just another false start.
Technical Picture
The setup, flagged by analyst Sssebi, suggests we're at an inflection point. Either buying pressure kicks in and pushes the price higher, or we see another rejection and drift back into familiar range-bound territory.
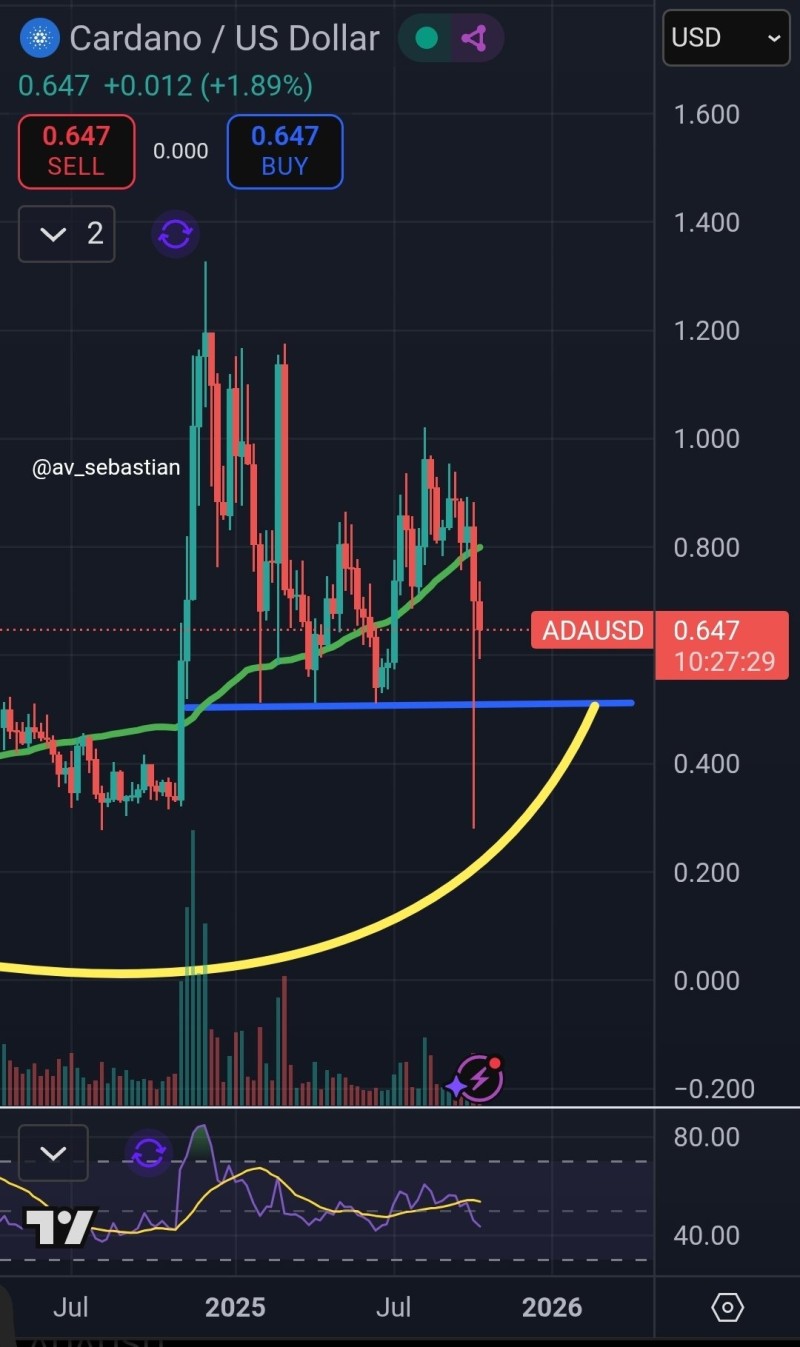
Right now, ADA is trading around $0.65, sitting just below the make-or-break zone between $0.70 and $0.72. That's where the 50-week moving average cuts across—a line that's been capping rallies for months. Below, there's solid support around $0.50, a level that's absorbed selling pressure multiple times this year.
What's interesting is the gradual rounding shape the price has traced out over recent months. It's not a sharp V-bottom, but a slow, steady curve—the kind that suggests patient accumulation rather than panic buying. This type of formation often precedes stronger, more sustained moves when it finally breaks.
The 50-week average has proven stubborn. Every attempt to reclaim it since early 2024 has been met with resistance. A confirmed weekly close above $0.70 would be the first real breach in nearly a year, and that matters. It's the sort of signal that gets technical traders paying attention and could pull sidelined capital back in.
On the flip side, if the price gets rejected here again, we'd likely see another test of that $0.50–$0.55 zone where long-term buyers have repeatedly stepped in.
Why This Level Matters
The $0.70 mark isn't just a number on a chart. It's both a structural ceiling and a psychological threshold. In past cycles, flipping the 50-week moving average from resistance to support has often kicked off stronger upward phases for ADA. A close above it this week would signal that the mid-term downtrend might actually be over, not just pausing. That kind of confirmation tends to bring in traders who've been waiting on the sidelines for proof of strength before committing.
But if it fails? We're probably heading back down to retest support, and the conversation shifts back to accumulation and waiting.
That slow, arcing curve visible on longer timeframes—what technical analysts call a rounding bottom—is worth noting. It's a pattern that reflects steady, quiet accumulation. Each dip finds buyers, volatility compresses, and selling pressure gradually fades. It's not flashy, but it's often reliable. If this structure continues to develop, ADA could be setting up for a longer upward move stretching into late 2025 or 2026, similar to recoveries we've seen in previous market cycles.
 Peter Smith