Peter Smith
⬤ The Gold-to-Bitcoin ratio is back at a key downtrend line that's been guiding market behavior for nearly a decade. According to @CryptoElITES, this same structural level sparked notable shifts across digital assets during previous touches in 2017, 2019, 2020, and 2023. Right now, the ratio is climbing toward the 0.045 area as it approaches this multi-year resistance zone again.
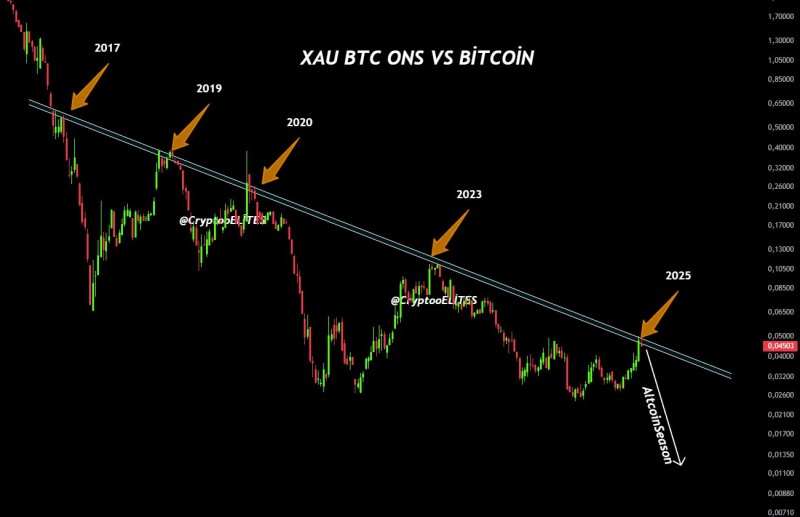
⬤ Looking at the bigger picture, this trend line has consistently capped the ratio's upward movements throughout its long-term decline. Every time the ratio tested this boundary over the past eight years, it eventually pulled back and continued lower. The current 2025 interaction looks remarkably similar to earlier patterns—the ratio's been grinding higher after spending extended time at lower levels, and now it's knocking on that same diagonal resistance door.
⬤ What makes this interesting is how the ratio's been compressing steadily over time, showing Bitcoin's long-term strength compared to gold. Those temporary spikes we saw in 2019 and 2020? They were followed by renewed drops as the broader downtrend held firm. Now that we're seeing another push higher into 2025, people are watching closely to see if history repeats—whether this trend-line touch might signal another shift in the digital asset landscape like it did in previous cycles.
⬤ These long-term comparative ratios matter because they capture evolving sentiment between traditional safe-haven assets and newer digital alternatives. When the Gold-to-Bitcoin ratio tests a structural level it's respected for years, it's essentially a checkpoint where the market reassesses which asset class is showing relative strength. The 2025 approach to this trend zone fits the historical pattern of previous market transitions, giving us useful context for understanding potential sentiment changes as the ratio engages with this critical level once more.
 Peter Smith