 Marina Lyubimova

Silver (XAG/USD) is showing remarkable resilience amid intensifying global trade conflicts, trading 0.5% higher around $32.00 and attracting investors seeking safe-haven assets during mounting geopolitical tensions.
Trade War Sparks Silver Market Dynamics
The escalating trade war between the United States and its North American peers, along with China, has created a volatile economic landscape. US President Donald Trump's confirmation of new tariffs—25% on Canada and Mexico and 10% on China—has triggered immediate retaliatory responses from affected nations.
Canadian Prime Minister Justin Trudeau announced immediate retaliatory tariffs on US imports, while the Chinese economy moved to impose tariffs on US agricultural products. Mexican President Claudia Sheinbaum Pardo emphasized that retaliatory measures are imminent, characterizing the situation as Trump initiating a "global trade fight".
Precious Metals Gain Safe-Haven Appeal
The heightened geopolitical tensions have significantly increased the safe-haven appeal of precious metals, particularly silver. Investors are seeking stable assets that can potentially protect their investments during uncertain economic conditions.
Market Indicators Supporting XAG Price
Several key market indicators are contributing to silver's current strength:
- 10-year US Treasury yields have tumbled to near 4.14%
- The US Dollar Index (DXY) has slipped to around 106.00
- Traders are increasingly betting on a Federal Reserve interest rate cut in the June policy meeting
The CME FedWatch tool now shows an 87% probability of a rate cut in June, up from 71% recorded just a week ago. These factors are creating a favorable environment for silver prices.
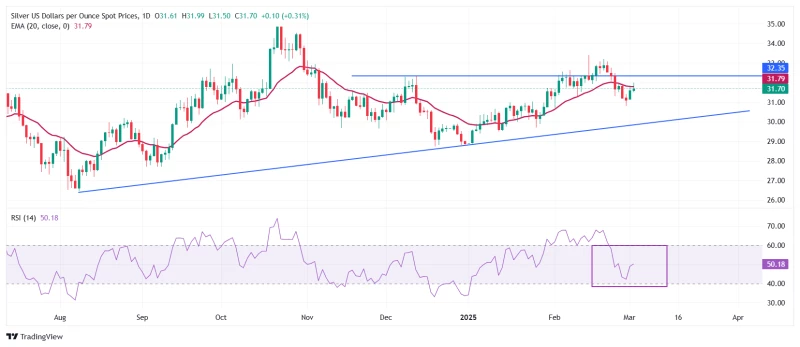
Technical Analysis: XAG Price Movement
Silver's technical outlook reveals interesting patterns:
- The price is moving higher but struggling to extend above the 20-day Exponential Moving Average (EMA) at $31.80
- The 14-day Relative Strength Index (RSI) remains within the 40.00-60.00 range, indicating fading bullish momentum
- The upward-sloping trendline from the August 8 low of $26.45 provides key support around $30.00
- The February 14 high of $33.40 remains a critical resistance level
Investors and traders should closely monitor these technical indicators while considering the broader macroeconomic context of global trade tensions and potential monetary policy shifts.
 Marina Lyubimova


