 Marina Lyubimova
⬤ Silver experienced aggressive selling pressure during overnight trading, briefly touching the lower boundary of a previously identified range. The metal wicked down into the $75.64 to $73.54 zone, perfectly aligning with the 0.786 Fibonacci retracement near $73.62 and the 50-day moving average—creating a dense layer of technical support.
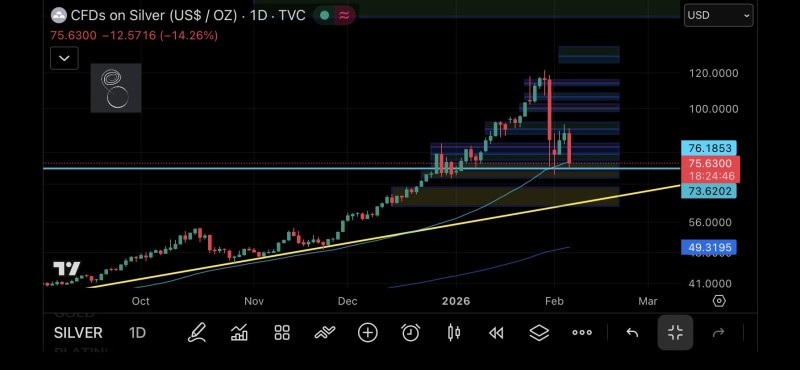
⬤ The chart captured silver trading near $75.63 after bouncing from this critical support cluster. Price action showed a precise reaction at the confluence where Fibonacci levels, moving average support, and horizontal structure all intersected. These three significant supports now act as the last line of defense before a potential retest of the major trendline becomes inevitable.
⬤ The contrast with gold's performance was striking—while gold dropped roughly 1.5%, silver at one point had plummeted more than 13% during the same session. This dramatic divergence underscored the heightened volatility characteristic of silver compared to its precious metals counterpart.
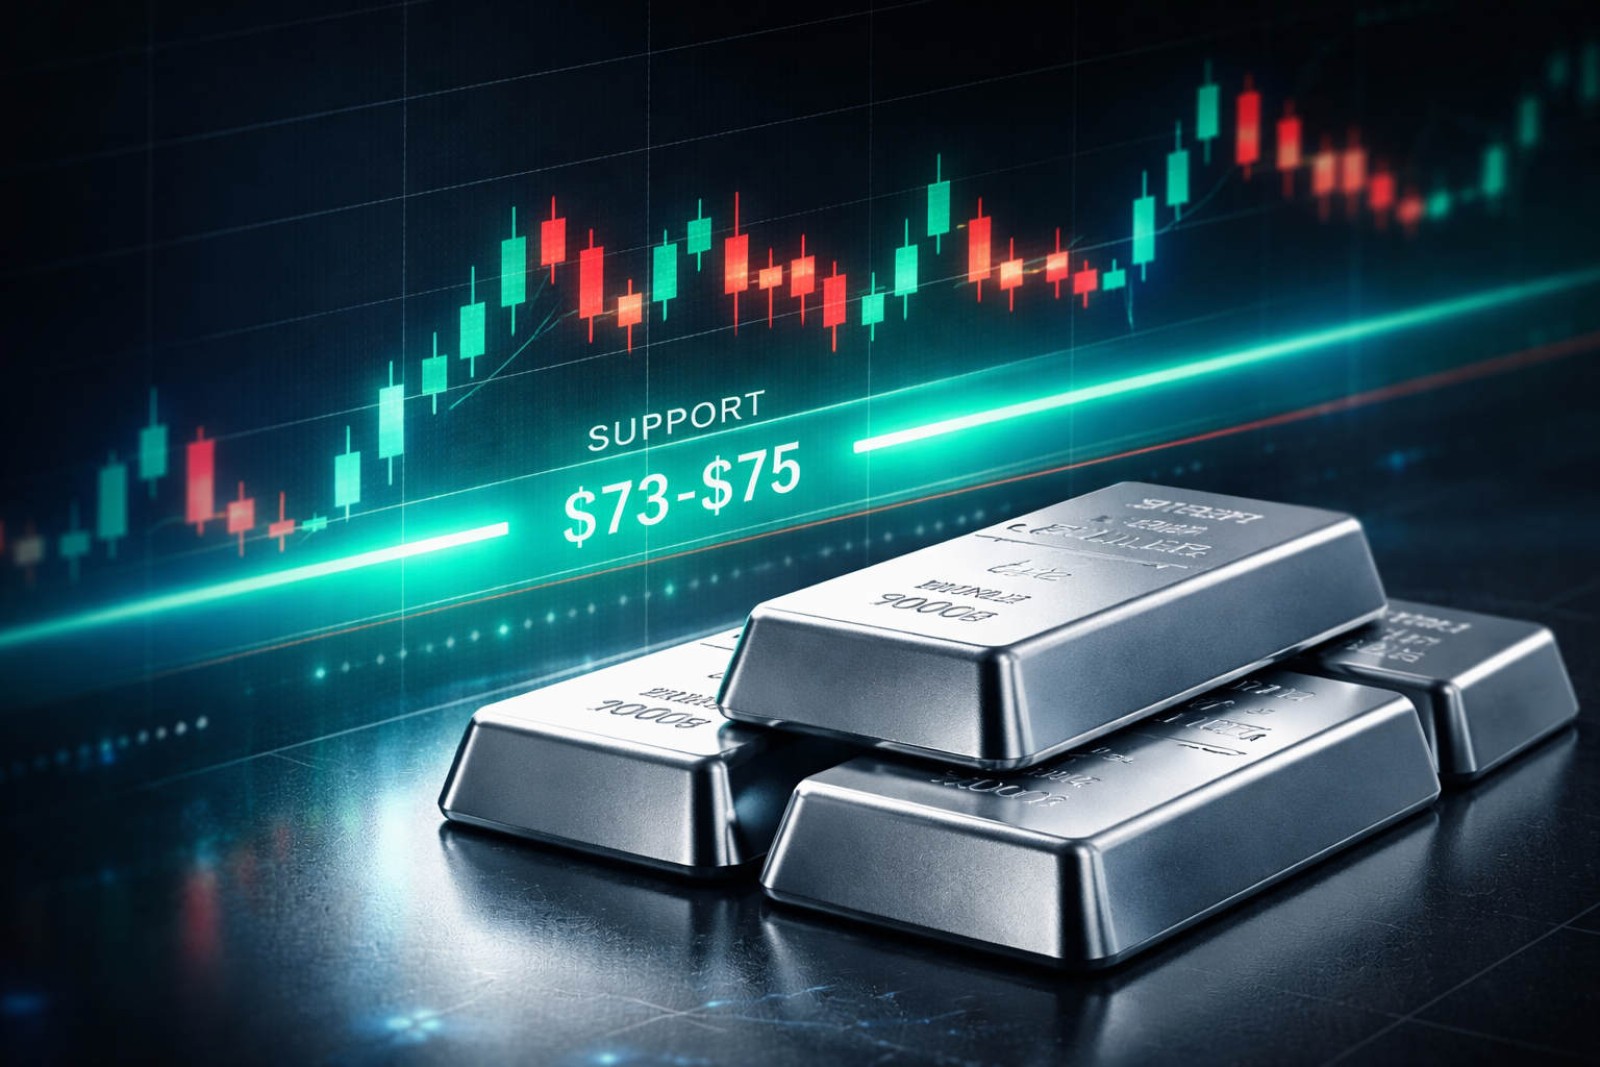
⬤ All eyes now focus on whether this support zone continues to hold. A breakdown below current levels would immediately shift attention toward the larger trendline area, while sustained trading above $73-$75 maintains the existing range structure and keeps the bullish bias intact.
 Marina Lyubimova


