 Eseandre Mordi

⬤ Silver pushed decisively through $100, hitting a milestone that reshapes its long-term price structure. The breakout kicks off a vertical phase after decades of steady climbing. The monthly chart shows silver trading around $110 following sharp acceleration, clearing historical resistance that held back advances since the early 2010s.
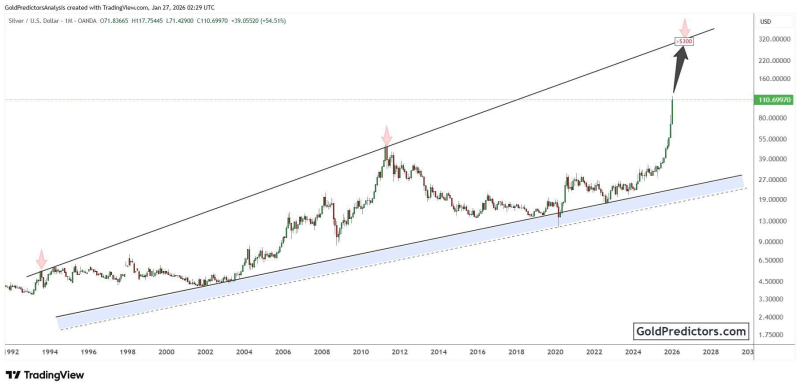
⬤ The long-term chart reveals a clean ascending pattern stretching back to the early 1990s. Silver has honored rising support across multiple market cycles, building higher lows inside a broad upward channel. Earlier peaks from the mid-1990s and 2011 lined up with long-term resistance. The current move above that line marks a structural shift from steady trend to rapid advance.
The breakout signals the beginning of a vertical phase following decades of gradual upward movement.
⬤ Long-term projections based on historical slope patterns point toward the $300 zone over time—a structural guide rather than an immediate target. The vertical surge reflects momentum kicking into high gear after clearing $100, pushing price into territory with few historical reference points. Silver has entered price discovery mode beyond its previous multi-year ranges.
⬤ This breakout carries weight across markets since silver serves dual roles as precious metal and industrial input. A sustained vertical phase can shift commodity sentiment, reshape inflation expectations, and impact sectors from manufacturing to energy transition. The chart shows how extended consolidation can unleash powerful moves once key resistance breaks, keeping focus on whether this momentum holds.
 Eseandre Mordi


