Eseandre Mordi
Silver managed a solid bounce off the 71.70 low, pushing back toward the mid-75 area, but the bigger picture hasn't changed much. The trend remains bearish for now. A short-term pop doesn't mean a reversal is in play.
What the Charts Say About Silver's Recovery
Momentum improved during the rally, but the market structure stayed intact on the bearish side. Silver trading below key averages continues to define the broader market bias heading into the next key resistance test. RSI climbed to around 56, which shows the bounce had real energy behind it without pushing into overbought territory. Volume ticked higher during the move up, and Bollinger Bands show price closing in on the middle band, a classic recovery signal rather than a breakout.
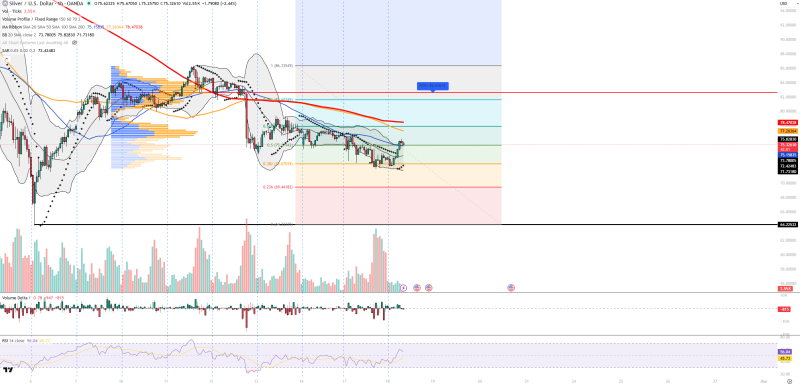
Parabolic SAR supports the near-term upside, but sellers are waiting. The 75.80–76.00 zone is the first wall price needs to clear, followed by 77.26 and 78.47. Beyond that, the volume profile flags 82.60 as the big supply zone where sellers came in hard before.
"Price continues trading below key averages, confirming that the broader trend remains bearish despite the short-term rebound."
Key Silver Support and Resistance Levels to Watch
Support sits at 73.78, 72.42, 71.73 and 69.44. On the upside, resistance levels are stacked at 75.83, 77.26, 78.47 and 82.60. Volume delta is close to neutral with a slight lean toward buyers, which fits the "stabilization" story more than a clean trend reversal. With silver price holding below resistance, the current move looks more like consolidation than the start of a sustained push higher.
Fundamental Backdrop
Silver stays sensitive to dollar moves and global growth vibes. A softer dollar could add fuel to any recovery attempt, and improving risk appetite would help too. But until price reclaims the upper resistance zones, the structure stays corrective. Recent price action fits the classic silver rejection near major resistance pattern rather than the start of a new bull leg.
 Eseandre Mordi