Usman Salis
⬤ Silver (XAG/USD) has pulled back sharply from its recent highs, dropping toward the $50-51 area in what's shaping up as a clear three-wave decline. The metal hit a short-term peak before reversing straight into a blue support region, creating a lower low on the short-term chart.
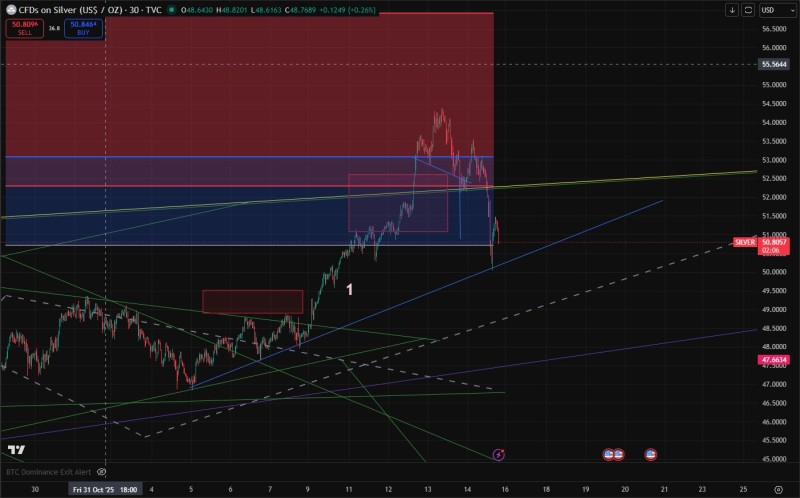
⬤ The chart shows silver falling from an upper resistance zone and landing directly on an ascending blue trendline. The three-wave sequence suggests that if selling pressure continues, the move could extend into a five-wave structure—making the pullback more significant. Previous consolidation zones and diagonal trendlines on the chart show how price has bounced around these levels during the recent rally and subsequent decline.
⬤ Silver is now testing the same rising trendline that's been supporting the uptrend since earlier this month. How the metal reacts here will be key—a bounce could signal the correction is done, while a break lower might confirm a deeper five-wave move is underway. For now, traders are watching this support zone closely to see if the recent rally can hold or if more downside is coming.
 Usman Salis