Peter Smith

After enduring weeks of consistent selling, the Global X Silver Miners ETF ($SIL) is finally showing some tentative signs of steadying. Traders are testing how much lower things can go, but a key support zone around the mid-$60s seems to be attracting fresh buying interest. That could mean the downside is running out of gas.
Chart Snapshot: Testing Support Within a Bigger Uptrend
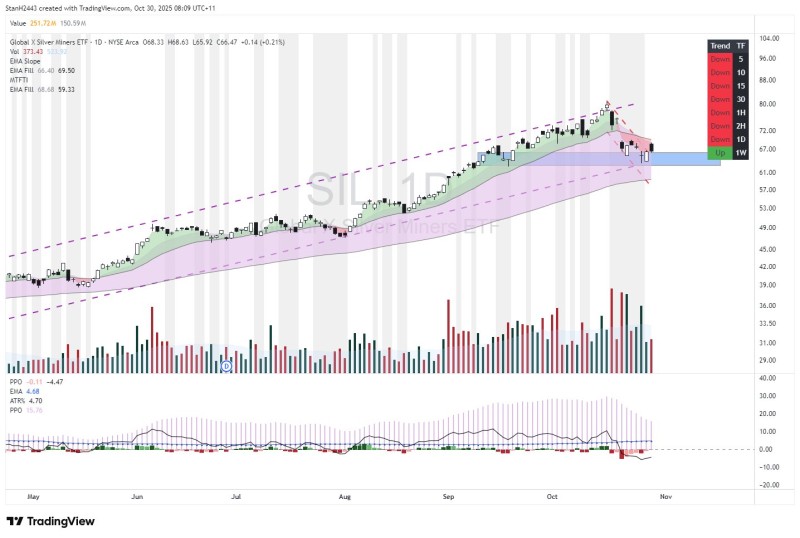
As Stan observed, the ETF managed "a bit of a bounce last night, then a soft close"—a pretty accurate snapshot of where silver miners stand right now. The daily chart shows a modest rebound after several down sessions, but the close was subdued—classic cautious behavior. $SIL peaked near $80 recently before sliding back along a descending channel (marked in red). But here's the thing: price is still moving within a longer-term rising channel (purple lines), which suggests the bigger uptrend is alive and well.
Key Technical Points:
- Primary Trend: Long-term direction is still up, even though the short-term action is corrective.
- Support Zone: Currently testing $64–$66 (highlighted in blue), which lines up with the lower edge of the multi-month ascending channel.
- Resistance Zone: Overhead barrier sits around $70–$72, where the ETF recently struggled to hold a breakout.
- Moving Averages: The 20-day EMA ($69.5) has turned down, while the 50-day EMA ($66.0) is flattening—confirming a short-term cool-off within an otherwise solid structure.
- Volume: Elevated compared to earlier in the summer, showing active participation during this pullback.
- Momentum Indicators: The PPO is slightly negative at -0.11, but the histogram hints at early convergence—possibly a bullish signal. ATR at 4.70 points to ongoing volatility, typical at turning points. Short-term timeframes (5D–1D) show "Down," but the weekly trend just flipped to "Up," favoring buyers longer-term.
The candlestick pattern—a bounce followed by a narrow close—screams indecision. Bulls are trying to defend support, but confidence is fragile. Overall, momentum is neutral to slightly negative, though selling pressure seems to be fading.
Market Context: Silver Faces Mixed Signals
Silver has been consolidating lately, bouncing between $26 and $28.50 per ounce as traders digest mixed signals—U.S. Treasury yields, interest rate expectations, and shifting safe-haven demand all playing a role. For mining stocks, this means higher volatility. Industrial demand for silver (especially from solar and electronics) remains strong, but investor sentiment has turned cautious amid broader risk-off vibes in commodities.
Still, many analysts see solid fundamentals for silver miners, particularly with gold stabilizing and the U.S. dollar losing some steam in late October.
The $64–$66 zone is make-or-break territory for $SIL. If bulls defend this area and push back above the 20-day EMA near $69.50, a short-term recovery could unfold—potentially retesting $72–$74. But if $SIL breaks decisively below $64, it could slide toward $60, the next major support level.
That said, the long-term trend is still pointing up. As long as price stays within that purple rising channel, the technical setup favors buying dips for patient investors.
 Peter Smith