 Marina Lyubimova
⬤ Silver's been on a tear lately, and it's now knocking on the door of a massive Fibonacci extension target around $70. The metal's monthly chart shows just how dramatic this climb has been—starting from the $30 zone and blowing through multiple extension levels along the way. What's particularly interesting is how the 4.236 extension sits right at $70.21, and XAG is basically there already.
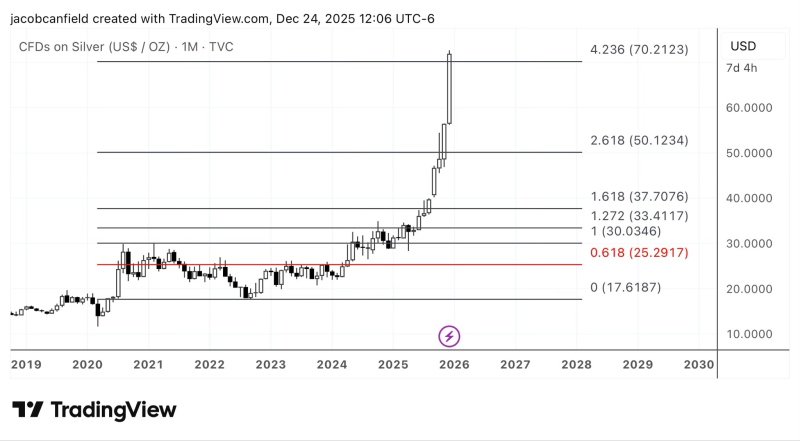
⬤ The technical setup uses classic Fibonacci logic, mapping out targets based on the previous high and the pullback that followed. Those projections include the 1.00 extension at roughly $30, the 1.272 at about $33.41, the 1.618 near $37.71, and the 2.618 just above $50. Silver didn't just meet these levels—it crushed through them. The speed of this move is pretty obvious when you look at the monthly candles, which have gotten noticeably longer in recent months as momentum picked up.
If silver rejects from the current area near $70, an obvious bounce area sits around the $50 level.
⬤ If XAG decides it's had enough and pulls back from here, the $50 area looks like the natural place to watch. That level lines up almost perfectly with the 2.618 Fibonacci extension, giving it extra weight as potential support. Shorter timeframes like the hourly and four-hour charts also have their 200-period moving averages as backup references if things turn south. But for now, the trend's been nothing but bullish, and the real question is what happens at this technically significant level.
⬤ This matters because silver just delivered one of its strongest multi-year runs, and hitting a major Fibonacci target like this is a big deal for traders watching precious metals. Whether the metal consolidates here, bounces off $70, or somehow keeps climbing will tell us a lot about how durable this rally really is. With price sitting right at the top of this technical framework, all eyes are on how the market handles these long-term resistance zones.
 Marina Lyubimova


