 Usman Salis

⬤ Platinum's climbed after closing just above its previous high, then tacked on another 0.8% in the next session. This breakout puts the metal in an interesting spot—if buyers can hold these levels, we could see more upside ahead. The daily chart shows platinum trading comfortably above a key horizontal resistance that's been capping prices, suggesting renewed buying momentum after weeks of sideways action.
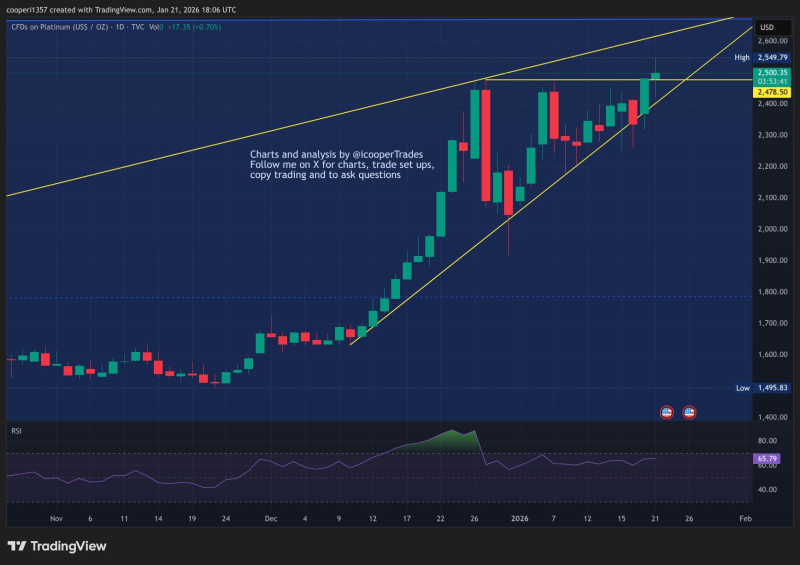
⬤ Looking at the bigger picture, platinum's been on a solid run since bouncing off the 1,500 area. The rally's built a nice staircase pattern of higher highs and higher lows, which is exactly what you want to see in an uptrend. Breaking above that prior high matters because it's where sellers stepped in before. If this break sticks, traders will be eyeing the upper yellow trendline on the chart—that's the next resistance zone that could slow things down.
This move places platinum in a position where confirmation of the breakout could lead to further upside.
⬤ What about the downside? There's a pretty clear safety net. The lower yellow trendline's been doing its job as support throughout this rally, catching every pullback. As long as platinum stays above that rising support line, the bullish setup stays valid. The RSI sitting around mid-60s tells us there's strength here without being overdone—it's not screaming overbought yet, which leaves room for more gains if momentum continues.
⬤ Here's why this matters: platinum's now trading in a well-defined channel between resistance above and support below. The next few sessions will show whether this breakout is the real deal or just a head fake. A sustained move higher confirms the trend, while a slip back below support would signal it's time to consolidate. Either way, the technical structure gives traders clear levels to watch.
 Usman Salis


