Usman Salis

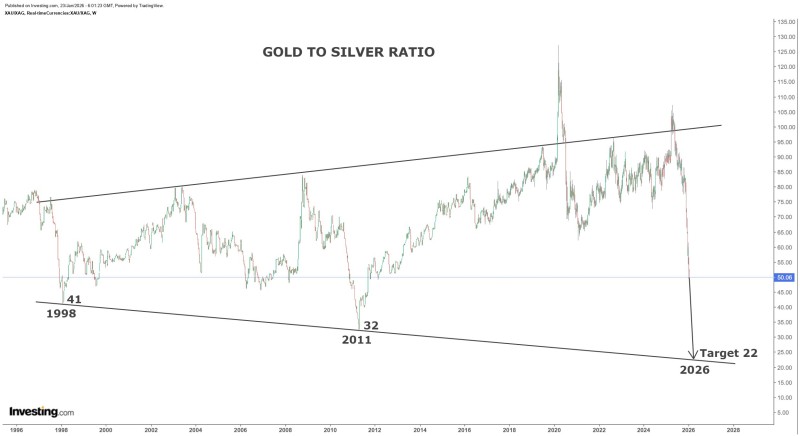
⬤ The gold to silver ratio has fallen sharply toward levels that historically triggered major turning points in precious metals markets. Long-term chart analysis connecting key lows from 1998 (around 41) and 2011 (near 32) reveals a declining structural trend projecting a potential target around 22. The ratio currently hovers near 50, breaking decisively below its recent range and moving closer to the lower boundary of a 25-year channel that's guided price action for over two decades.
⬤ Previous moves toward this channel's lower end coincided with periods of significant silver strength relative to gold, reflecting fundamental market cycle shifts rather than temporary volatility. The current breakdown positions the ratio within striking distance of support levels that could mark another major inflection point for precious metals.
⬤ If the ratio reaches its projected target of 22, the math creates compelling scenarios: gold at $6,000 would put silver near $272, gold at $7,000 implies silver around $318, and gold at $8,000 suggests silver near $363. These aren't standalone forecasts but mathematical outcomes showing what the ratio shift would mean at different gold price levels.
⬤ This matters because the gold to silver ratio serves as a critical long-term measure of relative value in precious metals. A sustained move toward historically low ratio levels would signal a fundamental shift in market behavior, potentially making silver significantly more attractive than gold. Such a transition could ripple through metals markets, mining stocks, and inflation-sensitive assets, demonstrating how decades-old technical structures continue shaping expectations in global commodity markets.
 Usman Salis